Diversity, a researched value of the digital humanities, appears very strongly in “Mapping Police Violence.” From racial difference to violence data in two different places in our country, the divide strengthens the data within the project.
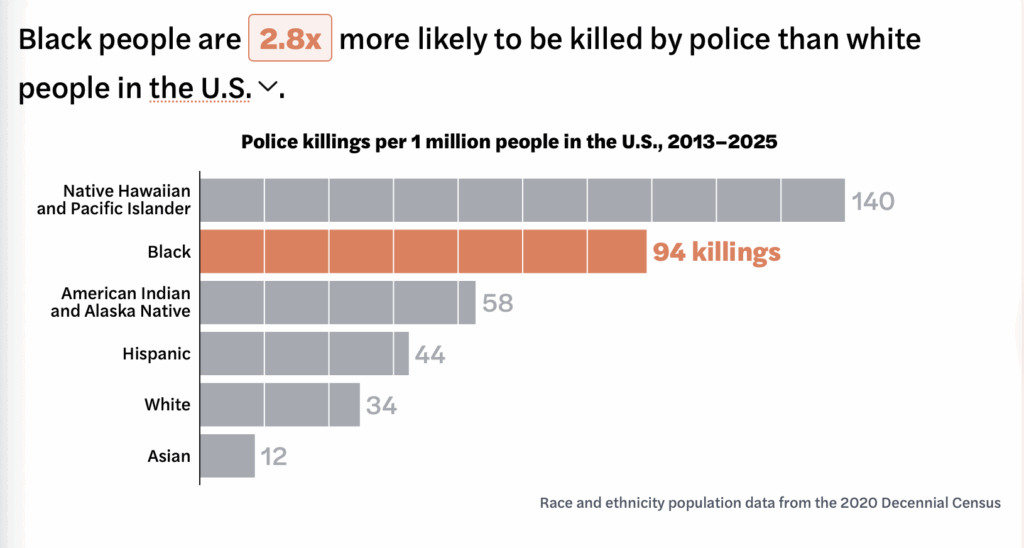
Geological diversity is provided, displaying the losses among different races in the cities of Chicago and St. Louis. Statistics are provided beside each involving the violent inequality of Black people falling victim to law enforcement.
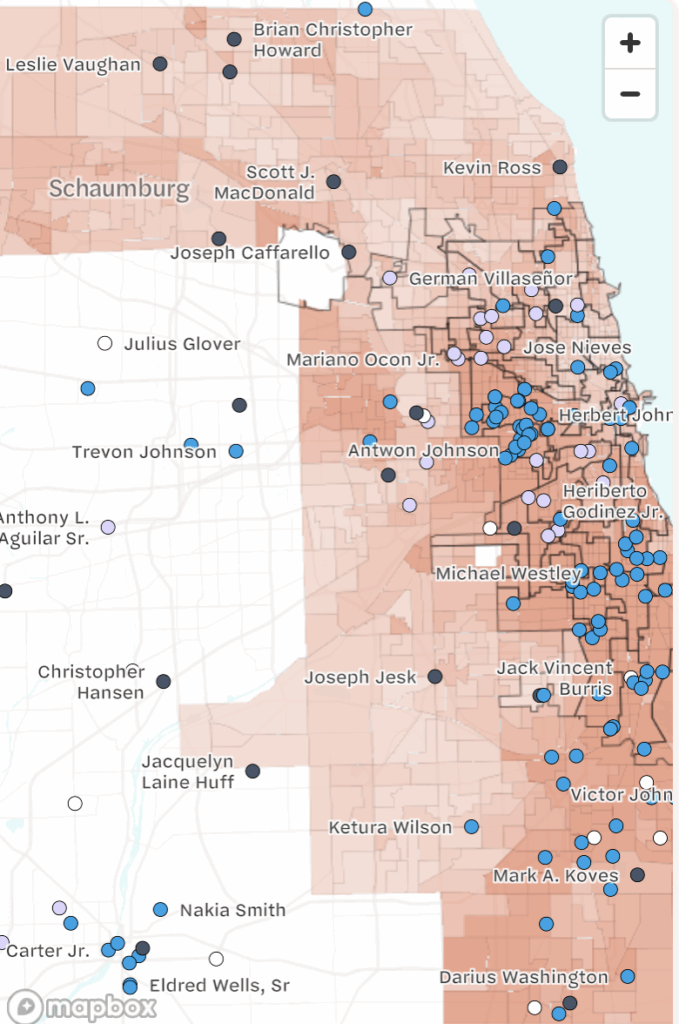
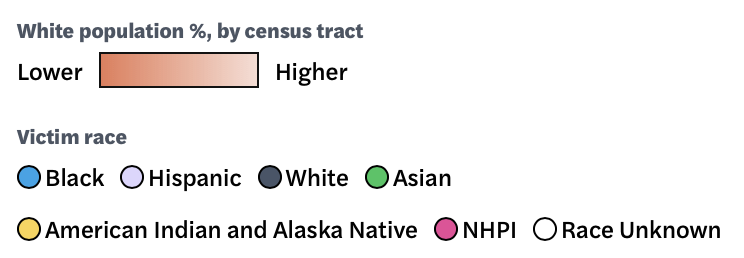
According to the data provided on the map, the project calculates that in Cook County, “Black people are 4.93x more likely to be killed than White people.” The location and names of specific victims bring the statistics to a more personal level, imagining if these victims were one’s loved one. Since the data listed started in 2013, in Chicago, “There have been at least 112 people killed by law enforcement.” 76% of the people killed by law enforcement were black, making them 30.6x more likely to be killed than white people. These numbers draw a drastic picture of diversified violence.
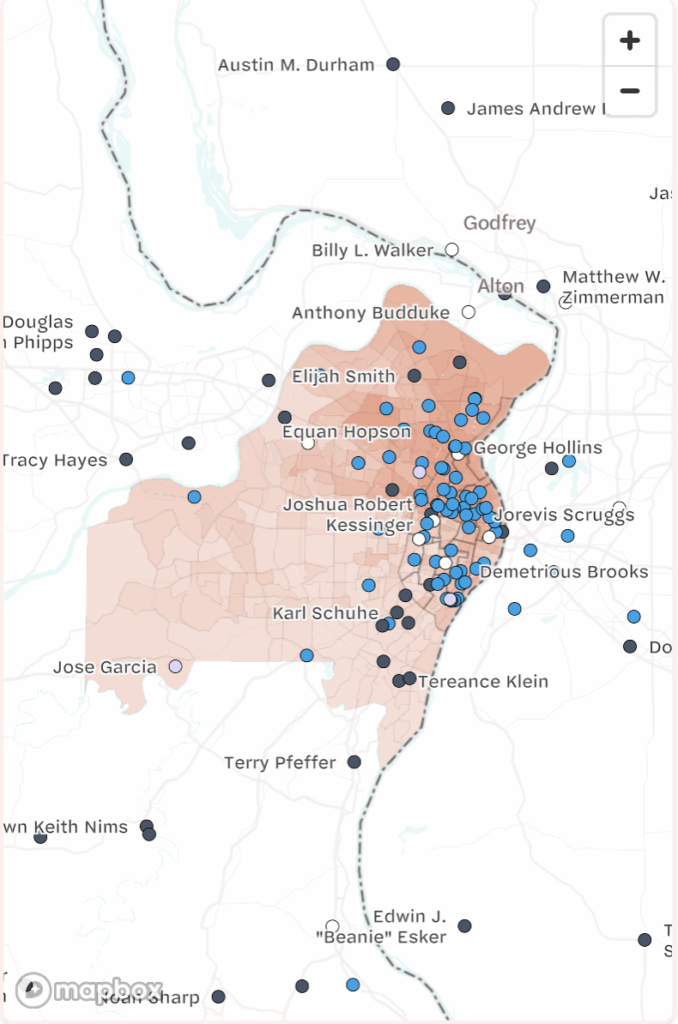
Using the same color-coding scales as above, discriminate violence is imminent in the blue. In St. Louis City, there have been at least 53 people killed by law enforcement, 81 percent of them being black. From this data, the project concludes that “Black people are 10.5x more likely to be killed than White people.”
The imagery and statistical evidence of diverse violence and discrimination exemplify the digital humanities’ value of diversity well.