The project at hand, “Mapping Police Violence,” displays the amount and category of police violence in our country. Using statistical displays, such as numerical data, calendars, maps, and bar and line graphs, to display the deaths of different groups of people. The goal of these statistical representations of violence is to make the “Most comprehensive accounting of people killed by police since 2013.” They’re informing the general public about the violence that is going on not only in their country, but within their own communities. Through a labeled map, the cities of Chicago and St. Louis have individual, detailed maps and captioned paragraphs detailing specific names, as well as broader facts. Larger than personal information, the project is exposing/criticising the government’s law enforcement systems, making them the antagonist audience of the project.
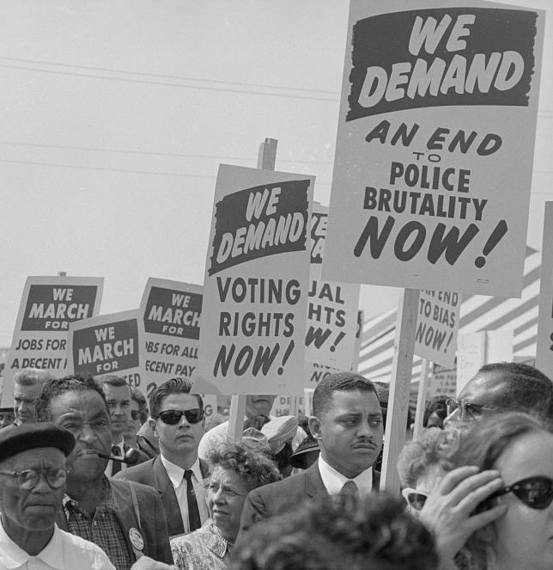
Similar to other projects documenting wrongdoing, the goal of publishing and providing cultural data is at play here. There are hundreds of shootings every single day in the United States, most of which are never reported or addressed with their lack of media coverage. Tables of thousands of people that have fallen victim over the past decade+ bring attention to those lots may not have heard of, increasing the realization for viewers, as well as criticism of police departments.
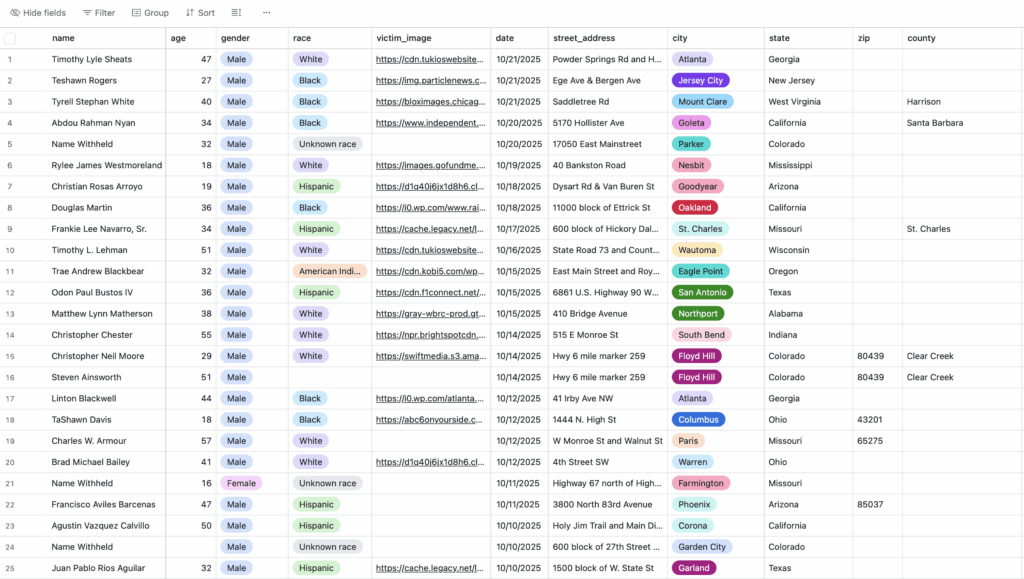
Publishing and providing statistical records of these continuous acts of violence make the reader aware of the tragic trend. Country-wide, as well as city diagrams, give a numerical record of deaths in our country’s lines, ranging back over 10 years. The availability of data keeps the public informed and alert to the danger and oppression our people face in communities. People will continue to fight and stand up to law enforcement violence as long as they’re properly informed with projects like these.