The method/steps taken to acquire data are clearly displayed on the “Mapping Police Violence” project page titled “Data and Methodology.”
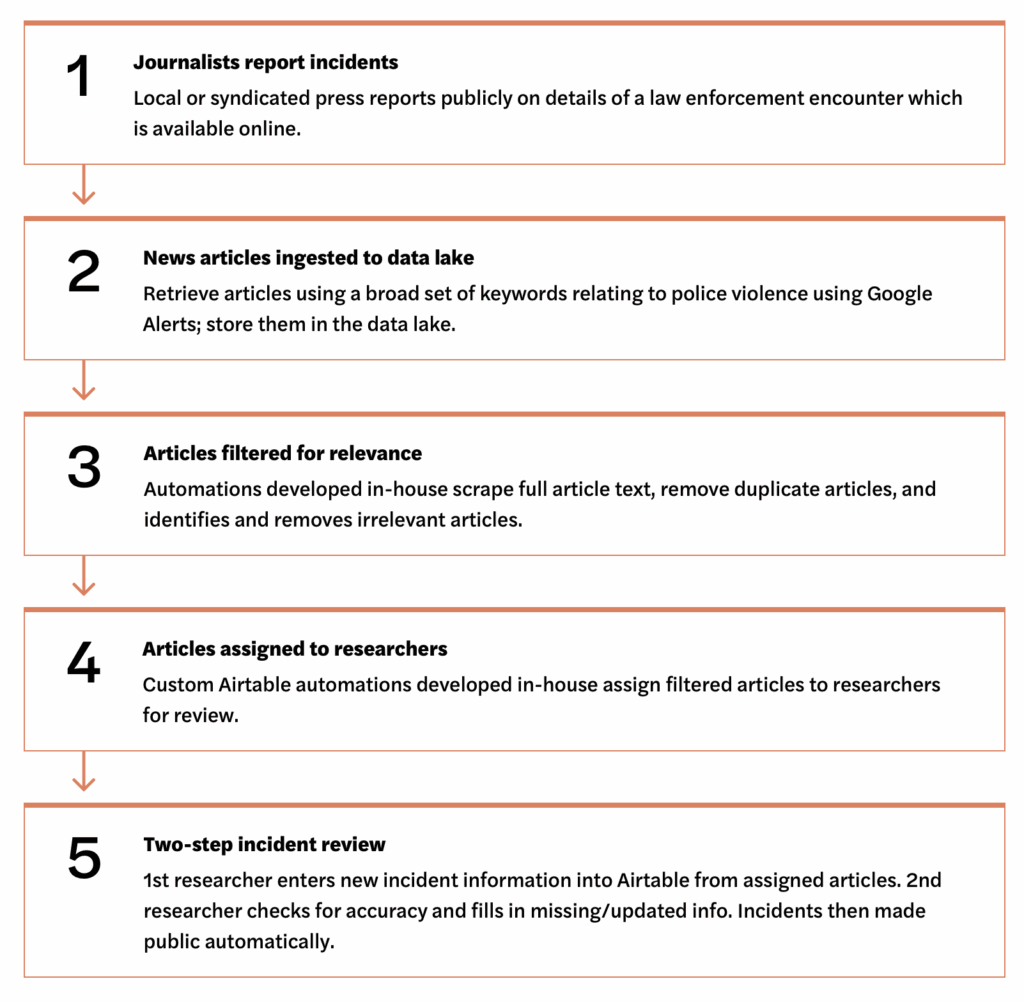
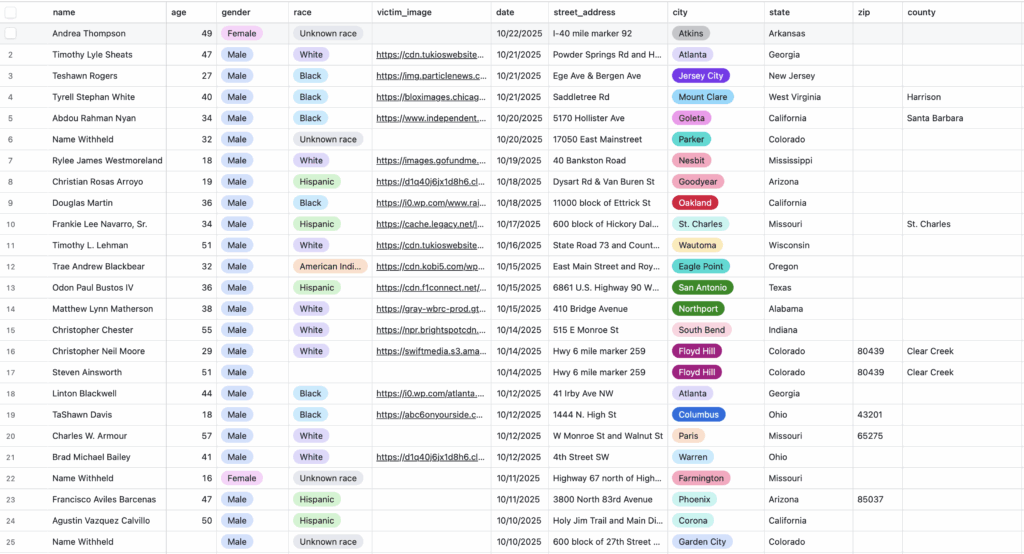
For example, step 3 revolves around retrieving and storing data of victim cases in a space called a “data lake” (data in its original form). This storing of data will eventually be documented in the Airtable, aligning with the documentation and publication goals of DH. Storing all this data in one place makes these findings easily accessible for the viewer. Visualization and examples of this data in Airtable are below.
The primary driving force and main method of data acquisition is through public news articles, where the public learns. The most recent fatal incident is cited on the project’s Airtable, the death in a vehicle pursuit of 49-year-old Andrea Thompson. All incidents recorded on the project have news links provided, giving viewers clear access to all information retrieved by the project.
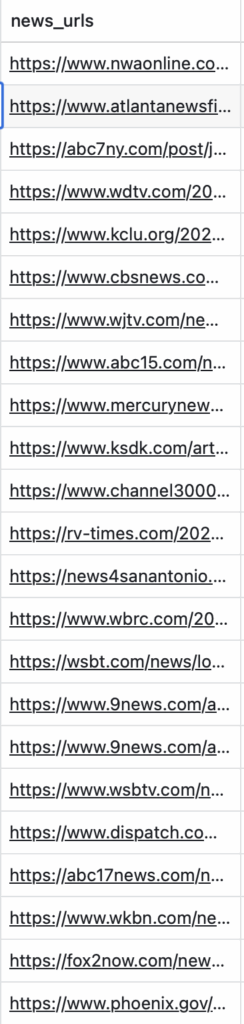
Airtable and diagrams/visuals within the project practice the documentation of the location, compiling, and visualization of data, common practices in digital humanities. Spreadsheets provide the epicenter for data collection for the project, while the calendar, maps, and diagrams visualize that data.