Data Collection and Cleaning – The team gathered data from government sources like ICE, CBP, and USAspending.gov, as well as reports from NGOs and news outlets. They cleaned and organized this information to ensure accuracy and usability, making it ready for mapping and analysis.
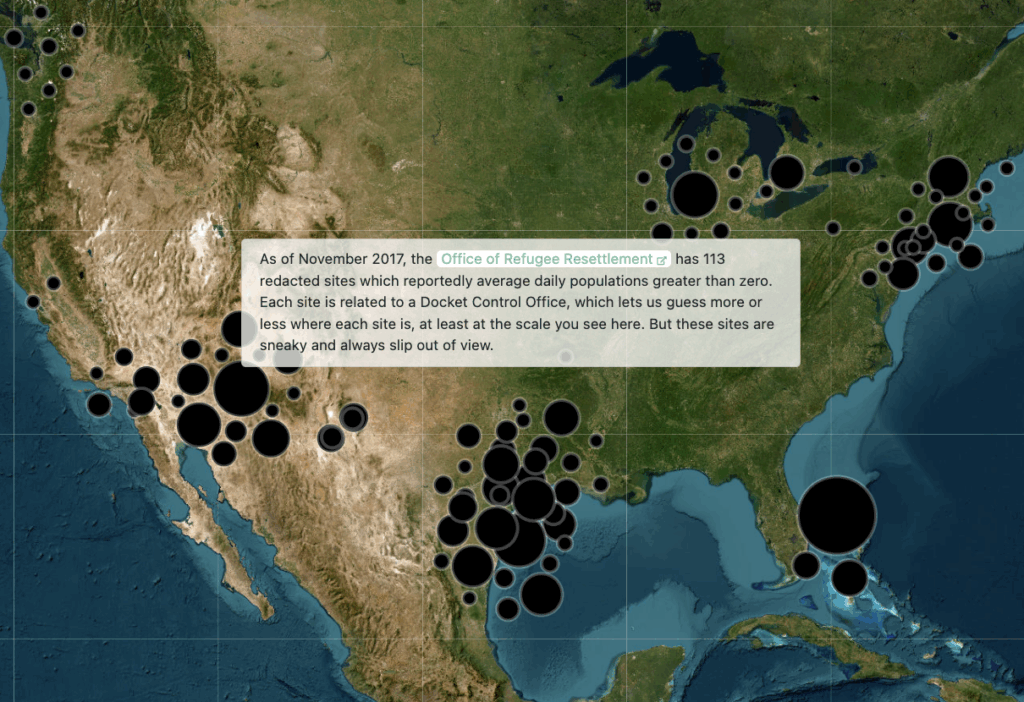
Interactive Mapping and Visualization – Using tools like Leaflet, the project created interactive maps and charts that allow users to explore the locations of detention centers, refugee facilities, and border patrol zones. This method turns raw data into visual stories that highlight patterns, connections, and social impacts.