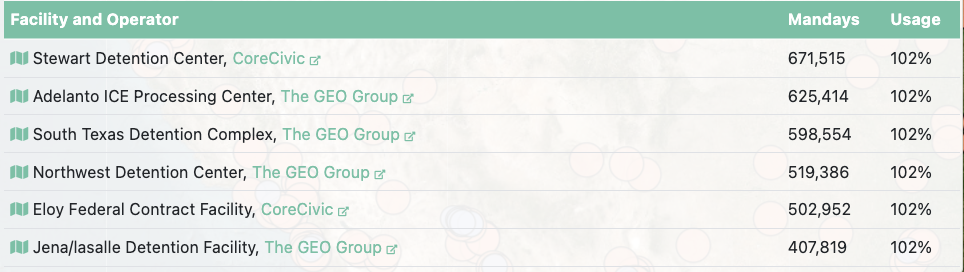
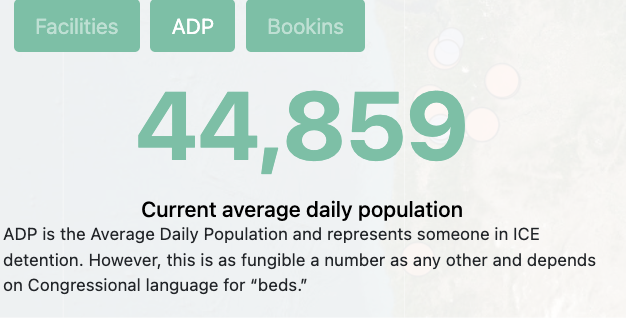
The data in this project depicts the current ICE facilities in use since 2014 and the amount of people detained, areas with increased border control that are considered traps, allied organizations, and refugee settlements. The data shows users how many facilities there are within the United States, and how heavily prepared immigration enforcements are. This relates to the goal of the project because the digital mapping data helps to inform the audience about the unknown number of ICE workers and facilities in the United States. Torn Apart is part of our Mobilized Humanities interventions, MH is scholarly activism in a global context and brings together digital tools to equip broad social awareness and help in global critical situations.
Input Data and Sources
- Public Government Data Sources
- Geographical data
- Activist and Human Rights Data
- Scholarly research
The data originates with information from the Torn Apart Seperado’s catalog of sources informing the reader about the areas of increased border patrol, active and inactive ICE detention facilities and their popluations, and offices of refugee across the United States.
- ICE.gov. “Removals by AOR FY 2009-February 25, 2017.” ICE.gov, 2017. https://www.ice.gov/doclib/foia/immigration_statistics/Removals-AOR-FY2009-Feb2017.xlsx .
- Elizabeth Contract Detention Facility.
https://www.ice.gov/detention-facility/elizabeth-contract-detention-facility
Output Data and Formats
The final output is a public, open-access dataset, and digital map available through the Torn Apart Website.
- Download the dataset as a gethub cvc file for further analyzation
- View interactive visualizations and maps explaining researchers findings
- Access researchers scholarly and reflective texts
https://xpmethod.columbia.edu/torn-apart/volume/1
Connection to Best Practices
Torn Apart follows digital humanities best practices by using data and mapping to make complex social issues easier to understand. The project is transparent about where its information comes from and uses digital tools responsibly to show the human impact of immigration policies. By making its maps public and easy to use, it connects technology, ethics, and social awareness to promote understanding and change.