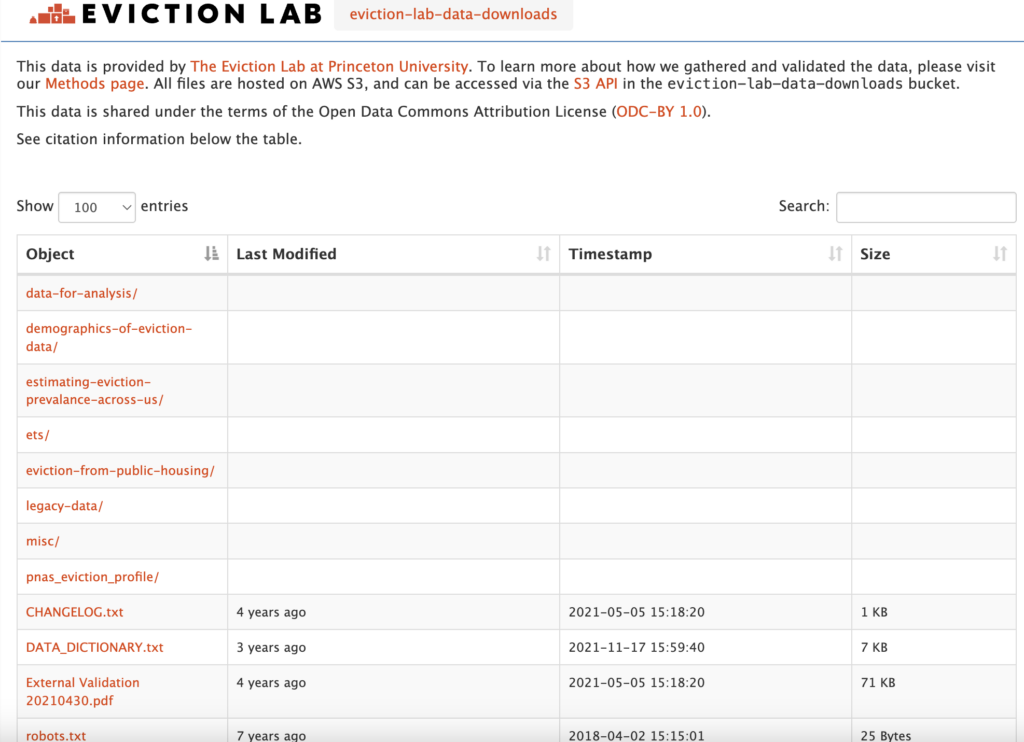
Eviction Lab makes processing eviction trends at the national, state, and local level simple by recording data on CSV (comma-separated values) files and providing modeled data on an interactive map. The input data is collected using Lexis Nexis from court records, census data, and local housing authorities, gathered from thousands of jurisdictions across the country from 1961 to 2019. Organized yearly by state and county with their respective FIPS (Federal Information Processing Standards) code, the raw output dataset shows the amount of households renting, the amount of eviction filings observed, the amount of court issued filings, and the amount of eviction threats that were observed. The map data is in a user-friendly format using MapBox to provide interactive visualized data. As the study is ongoing, no official conclusions have been drawn, but the data can give people the tools “to better understand—and fight—America’s eviction epidemic.”
Shocking Statistics
The Eviction Lab’s research has uncovered several alarming statistics that highlight the severity of the eviction crisis in the United States:
- High Volume of Eviction Filings: In a typical year, landlords file approximately 3.6 million evictions cases nationwide. This is equal to one in 40 renter households being evicted. Maryland, South Carolina, and Georgia have the highest rates of eviction among other states, challenging the general notion that eviction is a risk primarily associated with metropolitan areas. North Charleston, SC has the highest large city eviction rate at 16.5% of its residents being evicted in 2016.
- Repeat Evictions: Nearly one-third of all eviction filings involve repeated cases against the same household at the same address, indicating a cycle of housing insecurity.
- Disproportionate Effect on Communities: On average, filing and eviction rates are significantly higher among Black renters than White renters. Research indicates that women, specifically women of color, are most at risk for eviction. Domestic violence victims and families with children are also at high risk for eviction, all people who deserve safe and affordable housing.
Data Collection: Court records from 50 states were gathered through public sources, FOIA requests, state-level bulk data exports, and scraping where allowed. These included a wide variety of legal formats and structures.
Data Processing & Cleaning:
- Records were parsed using OCR for image-based documents.
- Natural Language Processing (NLP) classified case types.
- Duplicates and non-eviction cases were filtered.
Data Sources
- Eviction Lab Data Portal – Public data downloads and interactive maps
- Eviction Tracking Downloads – CSVs and geographic files by state and county
- American Community Survey (ACS) – Demographics and housing data
- LexisNexis CourtLink – Proprietary civil court data (used for nationwide coverage)