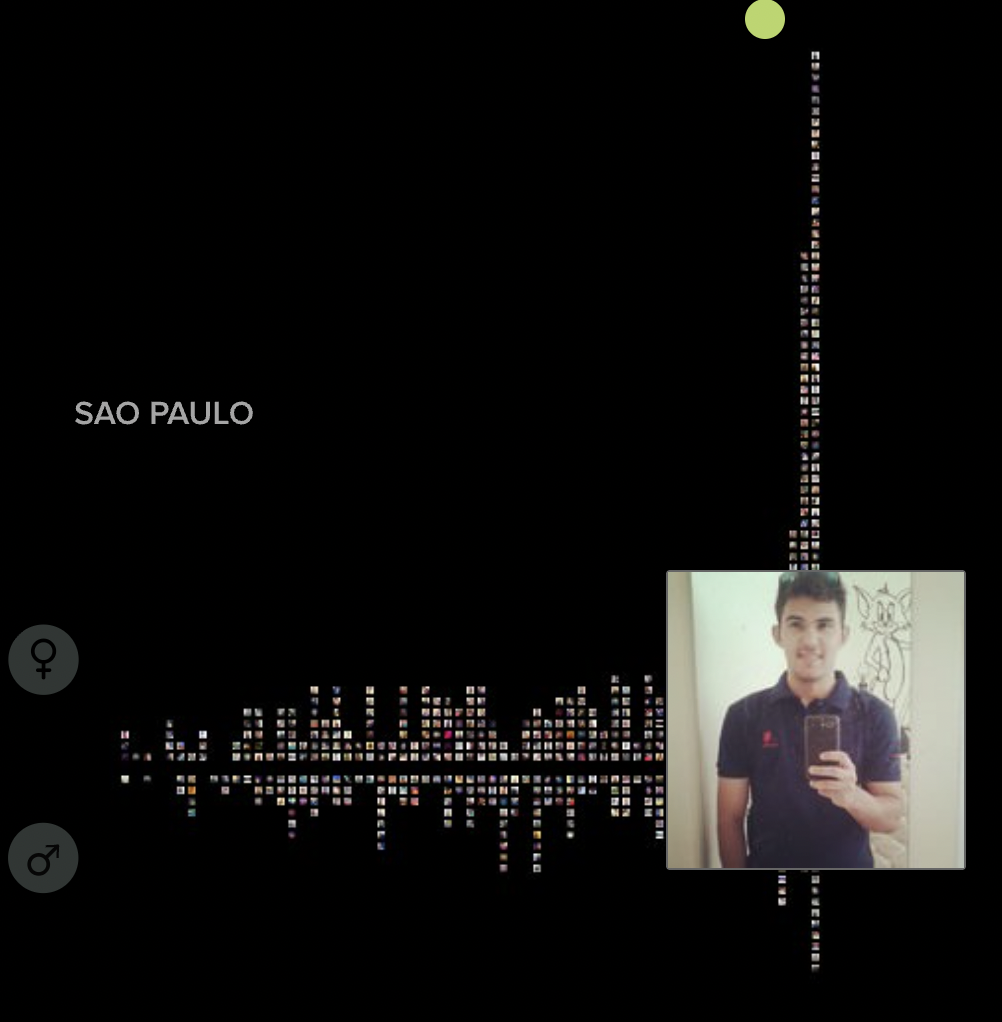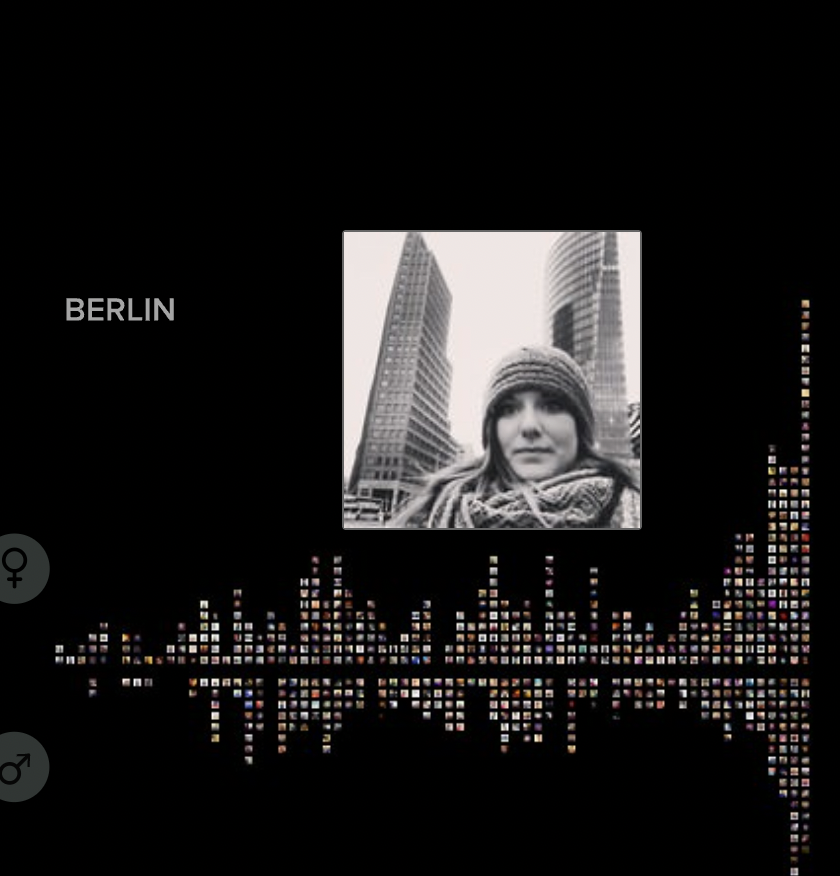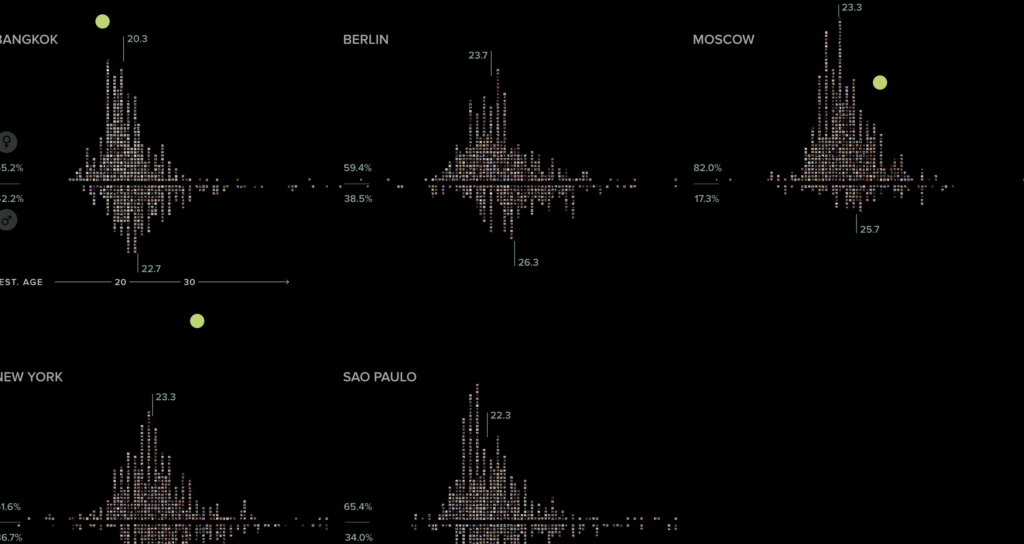
All of the data throughout this project is displayed in various graphs and visual aids. “This project is based on a unique dataset we compiled by analyzing tens of thousands of images from each city, both through automatic image analysis and human judgement.” The data that they show varies from analyzing emotions, angles, smile, gender, location, etc from a total of 656,000 images collected. The Selfiecity team wanted to showcase their data in interactive graphs that allow the viewer to get an exact idea on maybe why they organized these selfies in this way. The first data set showed is the imageplots, in gender and emotion graphs. These graphs are interactive, if you place your mouse over the graph you can see each individual picture taken. Some findings were ,the selfies were mainly women, Bangkok and Sao Paulo had the most smiles, and that the women in Sao Paulo had the most poses within in their selfies. Manovich and his team do not state how they made their data plots. Although their data is showcased and organized well there are some holes in the process, specifically about the location of the selfies. Instagram was still new at the time and the app got the locations from photos via API address. At the time and still now people don’t really share their locations on Instagram so people can lie about their locations or not put them at all. Manovich and his team didn’t realize these could be issues in their project. The way all of the data is formatted and displayed gives the receiver a clear shot and look of the goals of this project showing the diversity within the selfies. How their data is presented and shared does fit within digital humanities best practices of data formatting and giving a clean visual aids.