Technology
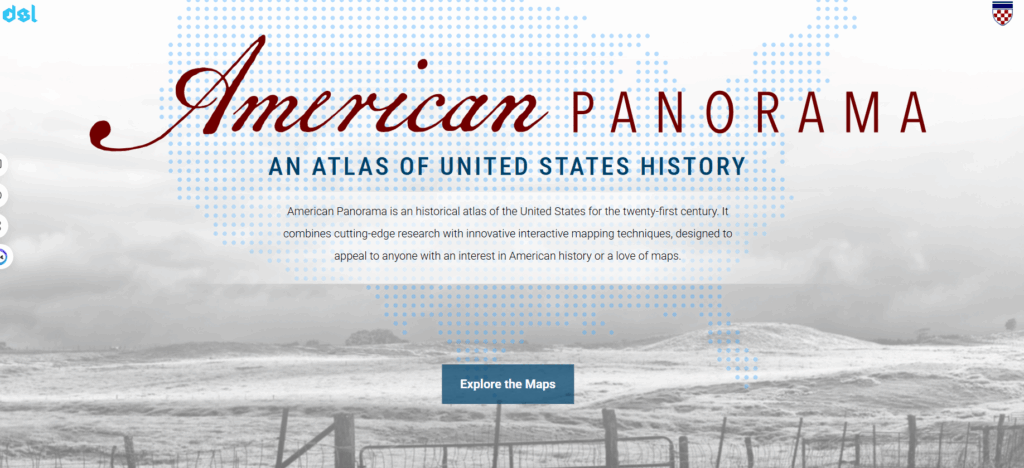
The Land Acquisition and Dispossession project uses digital mapping and data visualization tools to trace how the Homestead Act redistributed land across the U.S. from 1863–1912. Its goal is to make the history of land policy, settlement, and dispossession visually accessible to researchers and the public.
Tool 1 – ArcGIS(Mapping Tool):
- Description: ArcGIS powers the interactive map, allowing users to explore county-level data and Indigenous land surrender over time.
- Use in Project: These tools create layered visualizations that show geographic and shifts in land ownership.
- Use in DH: Commonly used in DH for storytelling, mapping historical events, and analyzing migration or social change
- Link to map: https://dsl.richmond.edu/panorama/homesteading/map/
Tool 2 – D3.js (Web Interactivity):
- Description: D3.js and JavaScript enhance interactivity and data filtering on the project’s site.
- Use in Project: They allow dynamic charts, pop-ups, and timeline navigation that allow the user to interact and discover historical data
- Use in DH: D3.js is widely used in DH to create visual analytics for archives, census data, and social networks.
These tools embody DH values of accessibility and collaboration, transforming raw government data into a publicly accessible resource.