The Phototrails project is a unique one because it is a different look at something people use everyday. Using millions of Instagram photos, it examines patterns between photos on a multi-scale level.
This evaluation will take a look at how well the finished Phototrails project accomplishes its goal, the methodologies used, as well as the ease to navigate the site.
Intent
Every project has a purpose, and it is a positive sign if the project lays out what the intent is. The purpose of the project and the questions the Phototrails team is attempting to answer can be found on the about page:
How do we explore social media’s visual data which contains billions of photographs shared by hundreds of millions of contributors? What insights can we gain from this type of massive collective visual production?
The first question they definitely provided an answer for, in the project itself. Phototrails is a project that shows massive amounts of social media visual data in an easy-to-view manner. They also talk about what insight’s are gained from the data and why it is useful.
Methodologies
This project uses four types of designs and visualizations in order to display the data. Each visualization type is a different way of presenting the data in order to reveal something new. The four visualizations used are: Montage, Radial, Photoplot, and Points and Lines.
Montage organizes the visual data according to upload date or visual attributes.

Radial organizes the data along a circular shape according to upload dates, visual attributes, or geographical coordinates.

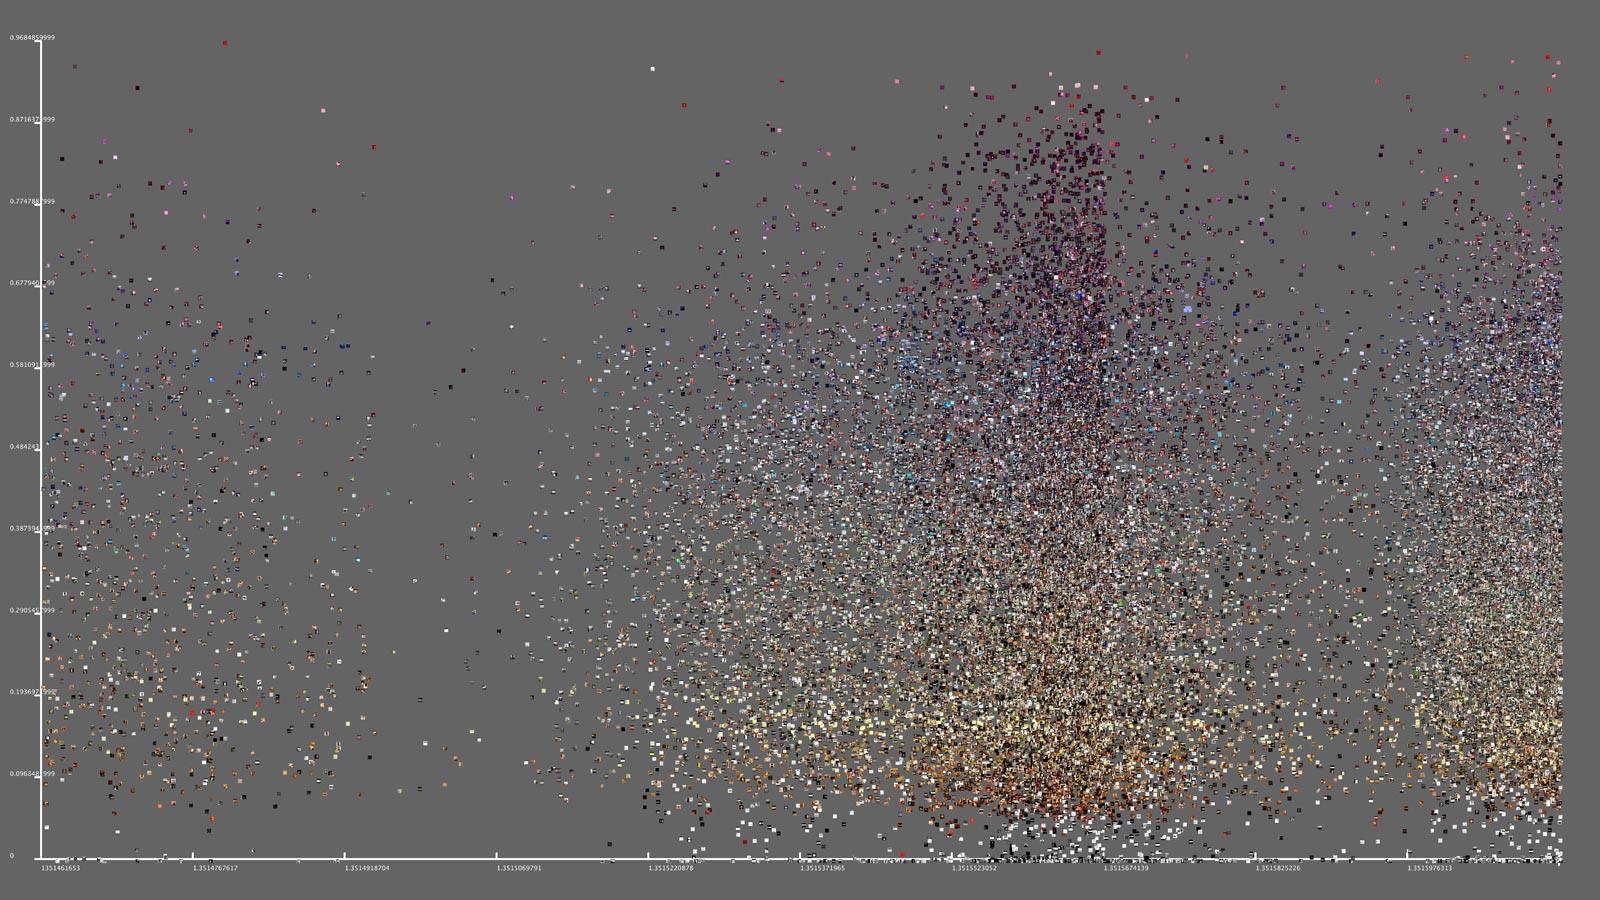
The Photoplot visualization uses a scatter plot outline, but graphs images instead of points.
The Plots and Lines visulazation is used to represent large amounts of data in a single condensed image of a city or county. The points are color coded for day and night.

User Design
The website design itself is very user friendly. It has different tabs at the top for whatever you are looking for. For example, the about page lets you know what the project is about and what it is for. The team page tells you the about the three creators of the project.
On the techniques page there are four images for the four methodologies. When you click on an image, a description of the methodology pops up and explains it.
Overall, Phototrails is very interactive and user friendly. It is incredibly easy to understand the website, the project, and any information you are trying to find out.
Conclusion
Phototrails is an excellent project, and an awesome contribution to the field of digital humanities. The intent of the project is clear and concise, the methodologies are very well executed, and the design of the website is extremely user-friendly. This project deserves all of the attention that it has.
