Phototrails is a digital humanities project that uses millions of Instagram photos to understand different people’s social, cultural, and political activity from around the world.
Description
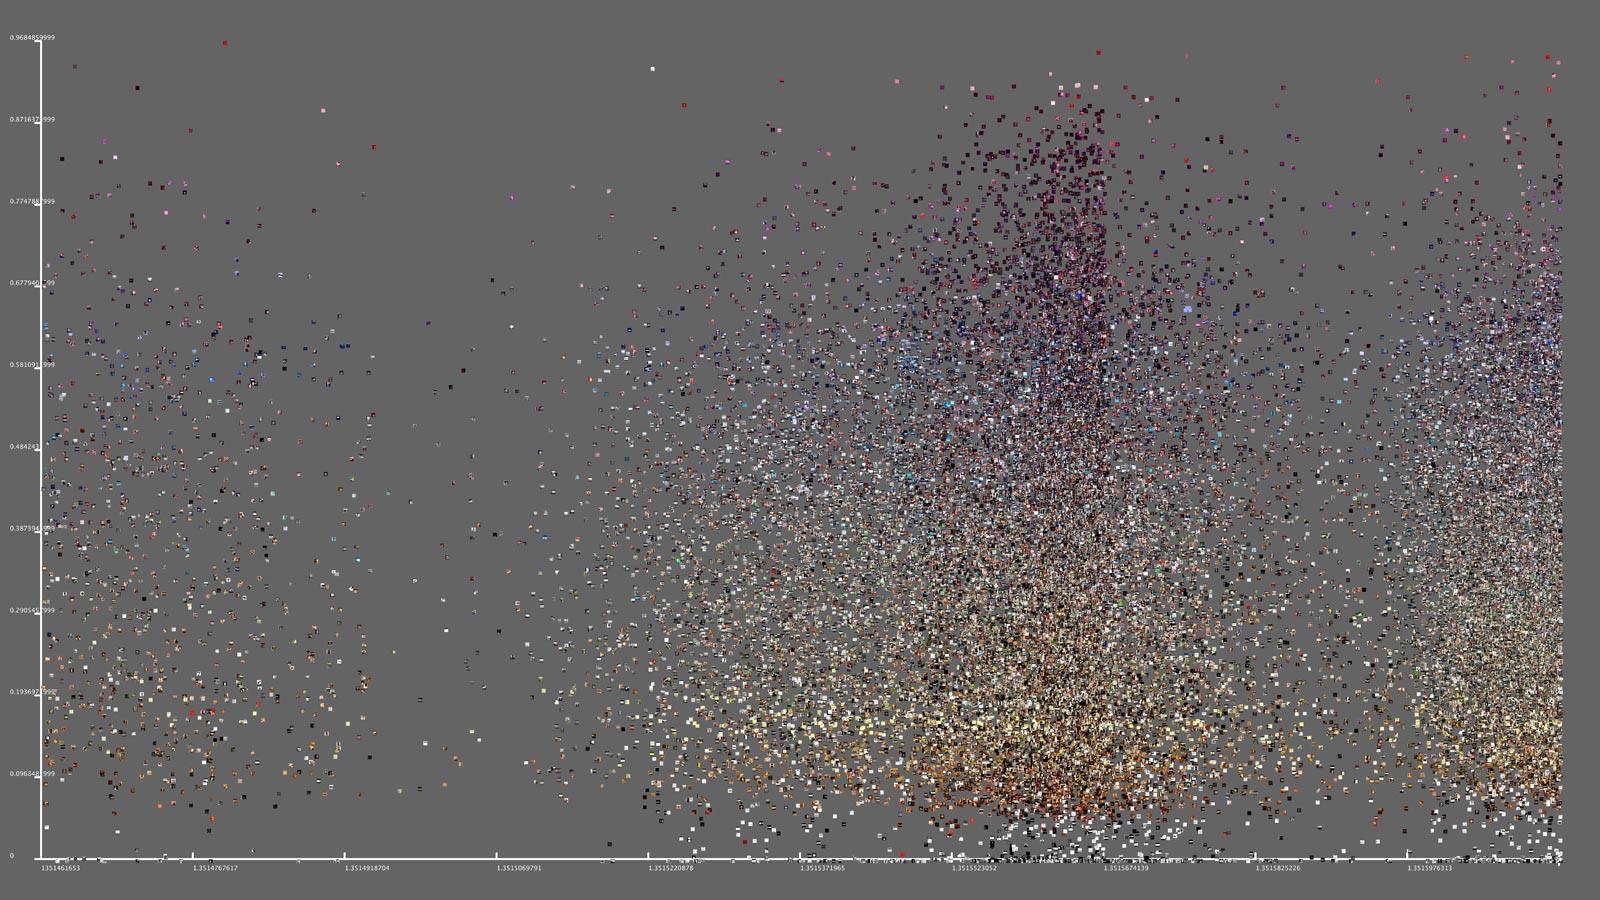
Phototrails is a way of exploring the visual data from social media, while attempting to gain an understanding from it at the same time. It uses experimental media visualization techniques to explore over 2 million Instagram photos from 13 different cities. This large number of photos can be portrayed in any size or order, such as: dates, location, visual characteristics.
This image is 33,000 Instagram pictures sorted by time and hue.
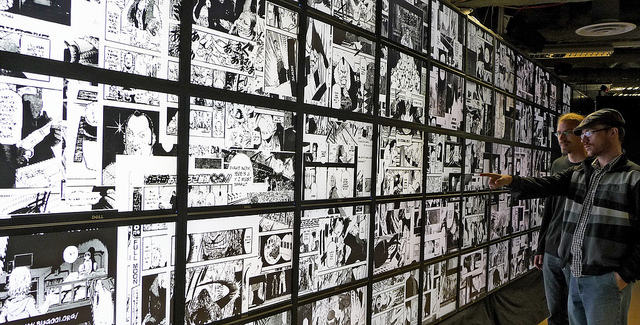
This project was created within the last five years, given the dates on the project site. “The Aggregate Eye” was an exhibition from October to December in 2013 as a part of the Phototrails project to generate patterns in social media user-generated photos.
“The Aggregate Eye” exhibition featuring some of the Phototrails creators.

Project Significance
The information in this project can be a extremely useful to reference in the field of digital humanities. Phototrails overcomes the problem of a limited view of images and patterns by using their multi-scale data vision instruments. This allows the user to explore patterns across tens of thousands singular images. This information can tell a lot about the culture patterns of a certain area, which could be a great reference in any digital humanities research.
This project is also apart of an emerging field of research, Cultural Analytics. This field uses computers and digital methods of research for the analysis of massive cultural data.
Team
Phototrails is a collaborative project created by Navad Hochman, Lev Manovich, and Jay Chow, and published by The History of Art and Architecture at the University of Pittsburgh, the Software Studies Initiative at California Institute for Telecommunication and Information, and The Graduate Center, City University of New York. The project is supported by The Andrew W. Mellon Foundation.
The media visualizations are all created using a free image visualization software tool called ImagePlot. The plot places images across a 2-Dimensional space in patterns of lines, points, and bars.
