Methods
There are four types of image maps that the project utilizes to create visualizations of public Instagram posts in several cities around the world. These maps are interactive in that the maps can be zoomed in our out, allowing the users to see as close as the individual post.
PhotoTrails uses “experimental media visualization techniques for exploring visual patterns, dynamics and structures of planetry-scale user-generated shared photos.” The site aligns images on a grid on specific axis that can be adjusted by the users’ criteria, such as dates, locations, or visual characteristics.
Radial
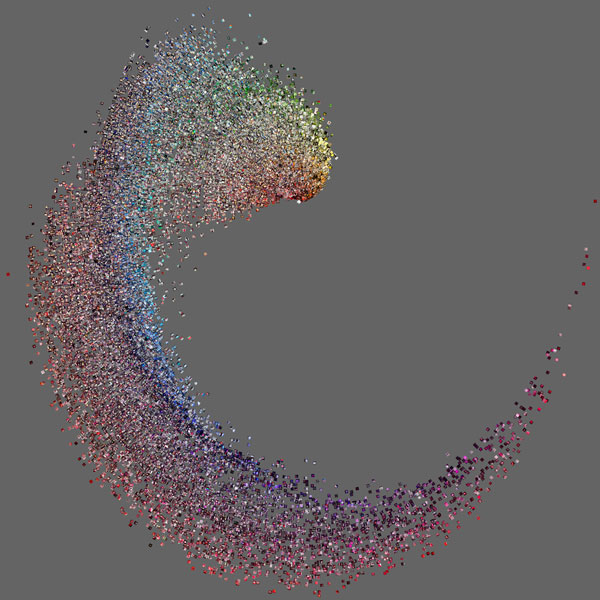
The radial maps collect data and arrange them in circular patterns. These are arranged visually, by hue, brightness, texture, etc. and by the time and locations that they are taken in. The image below, for example, is comprised of posts taken in Tel Aviv organized by hue.
Other images are arranged by hue and time, such as the map below, which is also from Tel Aviv.
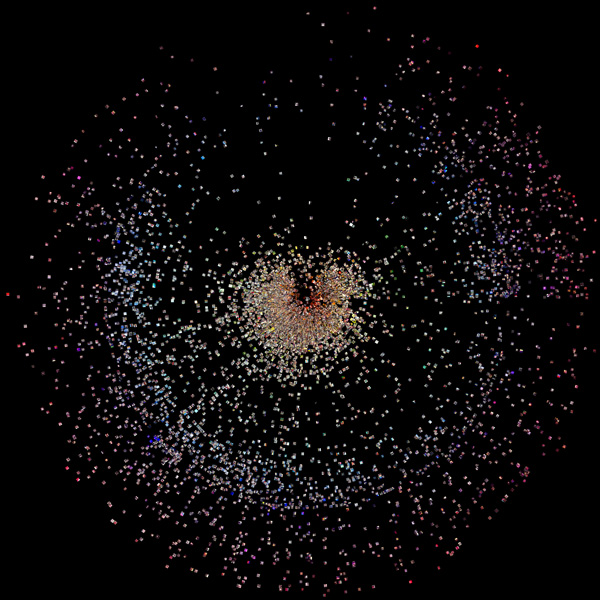
The team was especially interested in radial images as they help to map the patterns in times and color changes that photos adhered to.
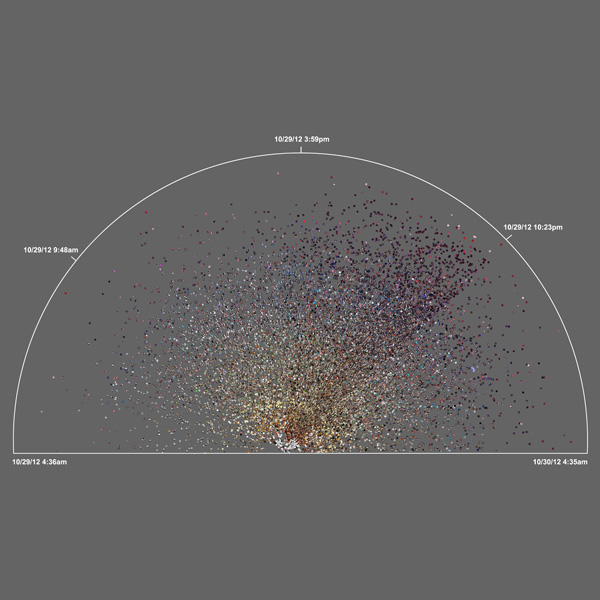
Posts on specific events have also been recorded, such as those taken during Hurricane Sandy in Brooklyn.
Montage
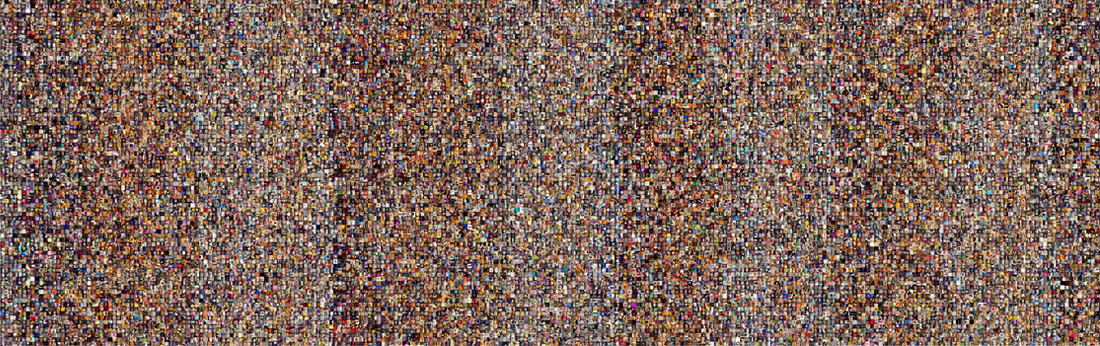
The montage pattern was created by stitching images together in a grid and are organized by either upload date of visual attributes, similar to the radial designs. The team has discovered that this organization reveals what they term ‘visual signatures’ of patterns that reveal day and night cycles.
Below are posts from Tokyo sorted by time of day.
PhotoPlot
PhotoPlot is the scatterplot comprised of posts that are organized over time. They help visualize image characteristics over time. The image below is an accumulation of 34,993 from Brooklyn taken during Brooklyn during Hurricane Sandy.

Points and Lines
Points and lines commonly plot posts in large urban spaces. They take the forms of maps or images aligned to fixed points, and range from sizes as large as cities, countries, or the Earth. They are color coded in green, yellow, and red according to times of day, morning, afternoon, and red, respectively. The plots reveal a concentration of post in particular hours geographically, and also the locations of users.
Below is a location comprised of 212,242 photos from over 3 months.
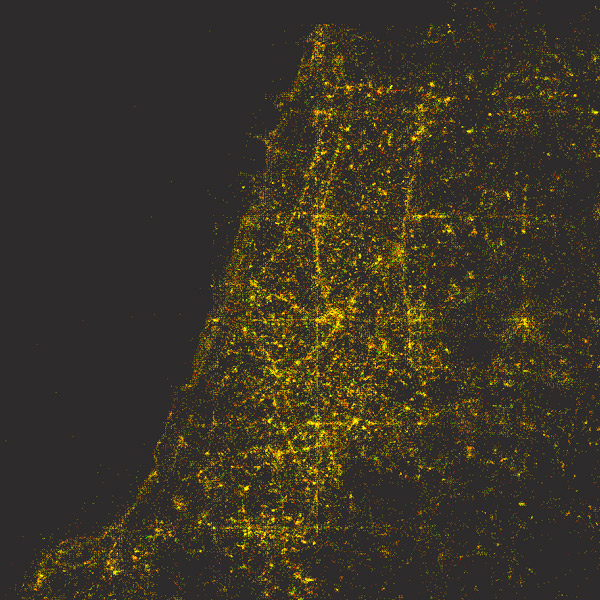
Below is a plot of 289 photos from Tel Aviv over 3 months.
