Methodology
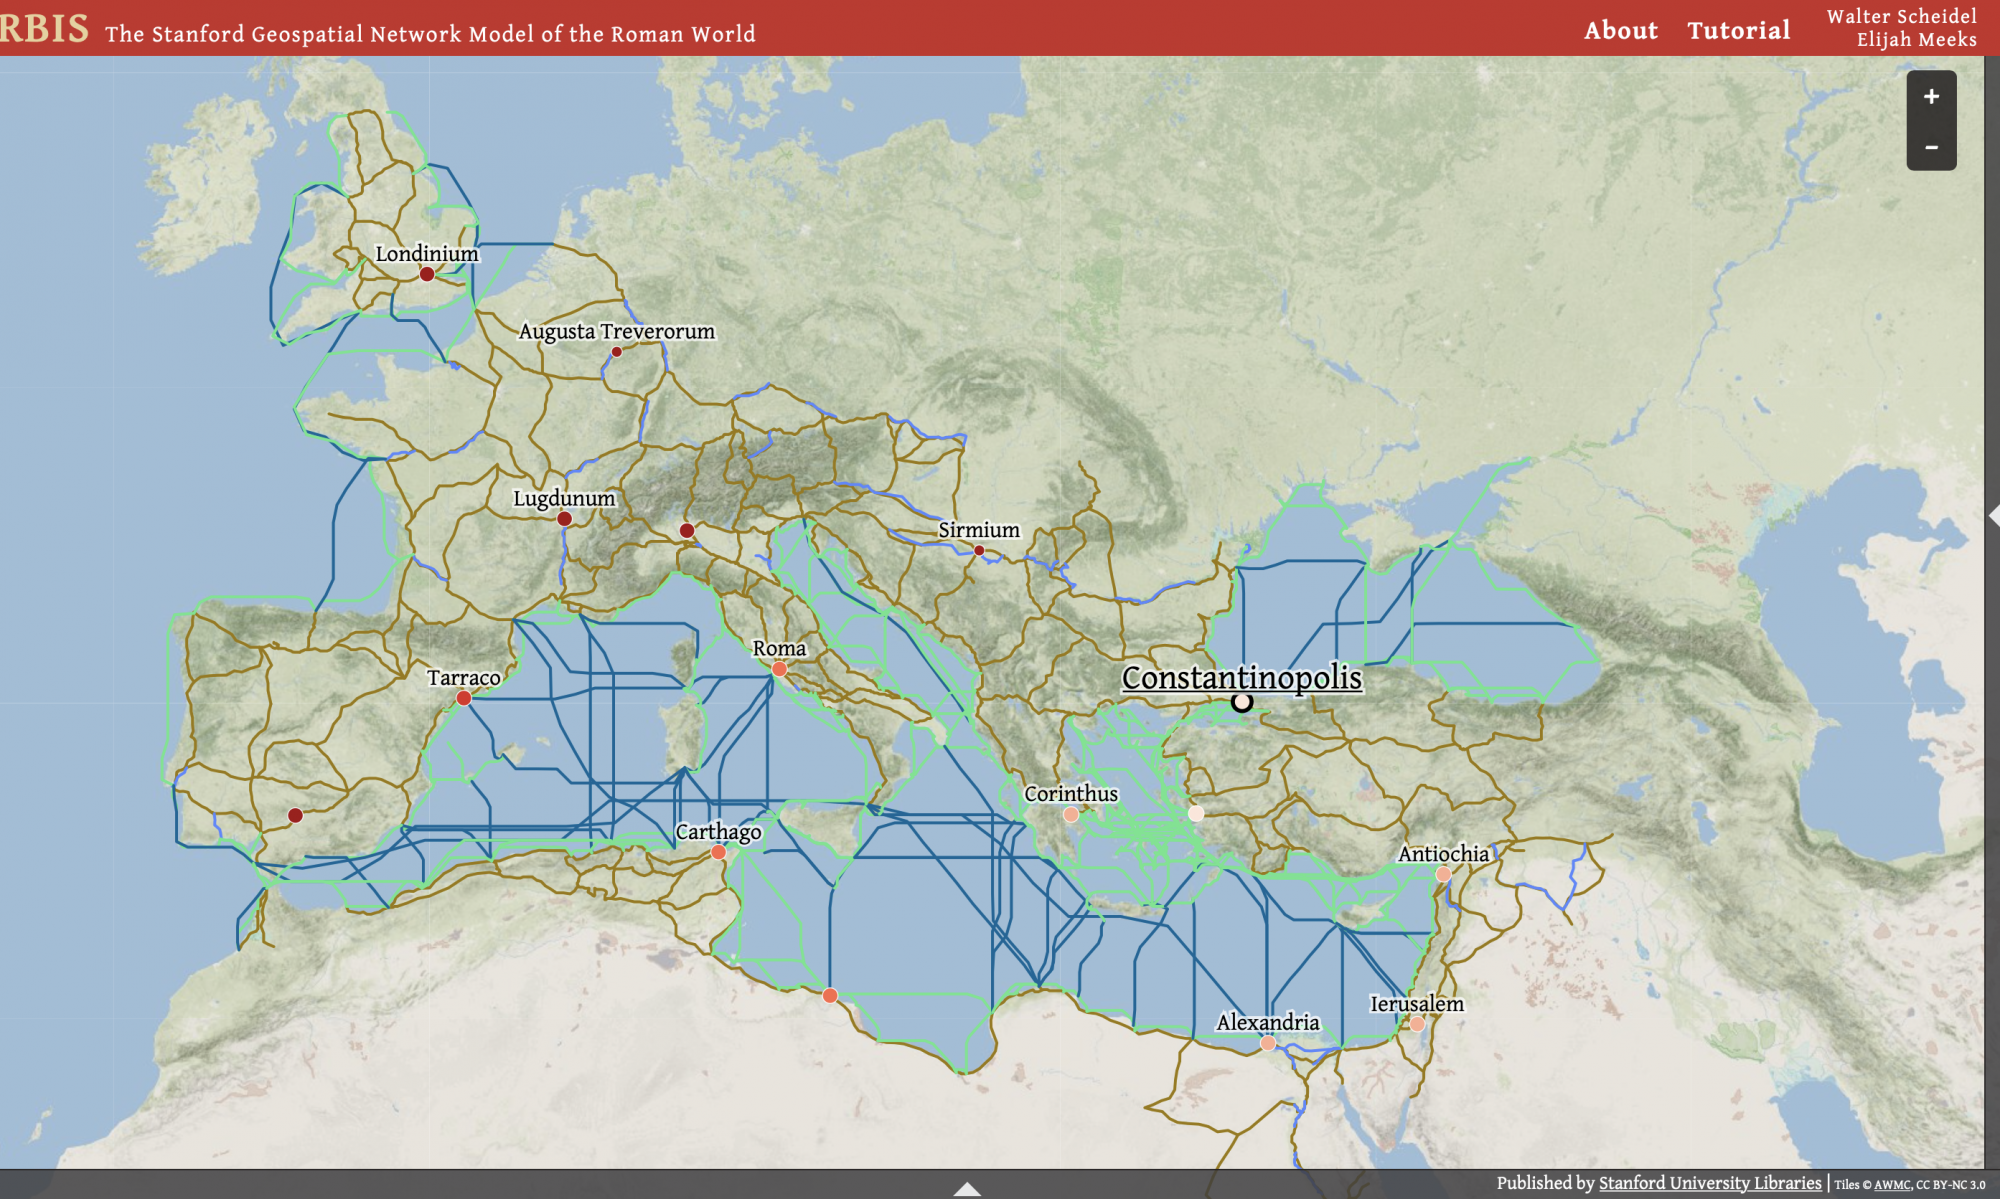
Orbis, the Network of the Roman World, is a geographical project built to provide an interactive depiction of the Roman Empire’s trading and transportation routes. The project was built using the JavaScript library D3.js which is a library used to produce dynamic interactive data visualizations in web browser. It makes use of the widely implemented SVG, HTML5, and CSS standards. According to D3.js’s website, “D3’s emphasis on web standards gives you the full capabilities of modern browsers without tying yourself to a proprietary framework, combining powerful visualization components and a data-driven approach to DOM manipulation.” A DOM is a document object model and again according to D3.js’s website, “For example, you can use D3 to generate an HTML table from an array of numbers. Or, use the same data to create an interactive SVG bar chart with smooth transitions and interaction.” Being able to take all the data we have about the Roman Empire and it’s trade/transportation routes and apply it to powerful visualization components within one website is what makes Orbis special, and it is the use of D3.js that makes that possible.
Another large part of the methodology of Orbis is the use of the GIS (Geographic Information System) which, according to ERSI (Environment Rating Scales Institute), “is a framework for gathering, managing, and analyzing data. Rooted in the science of geography, GIS integrates many types of data. It analyzes spatial location and organizes layers of information into visualizations using maps and 3D scenes. With this unique capability, GIS reveals deeper insights into data, such as patterns, relationships, and situations—helping users make smarter decisions.” Orbis is a perfect example of this description because it literally uses GIS to function.
Orbis is without a doubt a dynamic and interactive visualization of the Roman Empire’s trade and transportation routes. By using GIS and D3.js technology Orbis is able to provide comprehensive visualization and offer features like selecting the starting and ending location of a trip and altering a variety of travel conditions in real time. The user is able to select the mode of transportation, see the differences between land and water travel, the season of the year, weather conditions, and many other varying factors. As briefly touched on in the overview, the project’s designer Walter Scheidel, a roman historian at Stanford University, had a simple vision of this project: “this project seeks to improve our understanding of how a large scale system in this case the Roman Empire worked when it had its highest peak of controlled land. This goal is accomplished through the work the website does with the software of D3.js that allows for the extensive mapping and information visualization.”
In short, Orbis uses D3.js’s software and library as well as the GIS to provide a comprehensive visualization of how the Roman Empire operated in terms of trade and transportation routes. Orbis took advantage of the available software resources and used the knowledge of historical experts as well as digital databases to create a visual depiction of the ever expanding amount of knowledge and information we have on the Roman Empire’s operation.