How Data is Collected
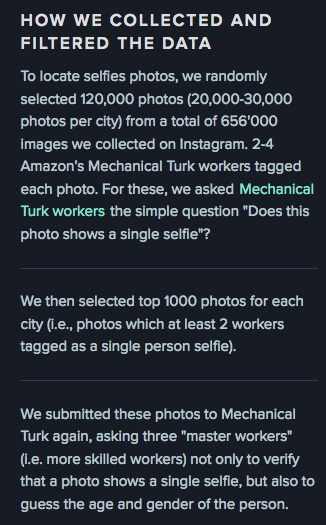
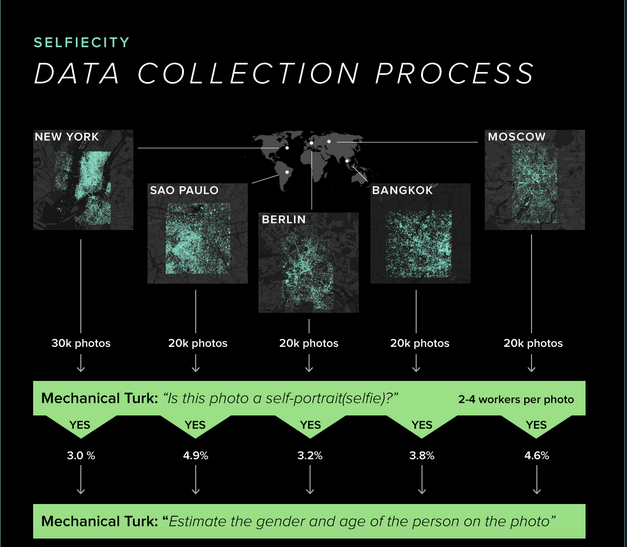
The project selects pictures randomly from Instagram. As quoted on the website “To locate selfies photos, we randomly selected 120,000 photos (20,000-30,000 photos per city) from a total of 656’000 images we collected”.The photos that are collected are analyzed in various ways. For example, the project uses a software called imageplots to determine the style of each city when it comes to selfies. Imageplots analyzes the photos by head tilt and the vertical axis shows you if people look up or down. Additionally, there is a feature that allows one to crop and rotate the photos to center the faces.
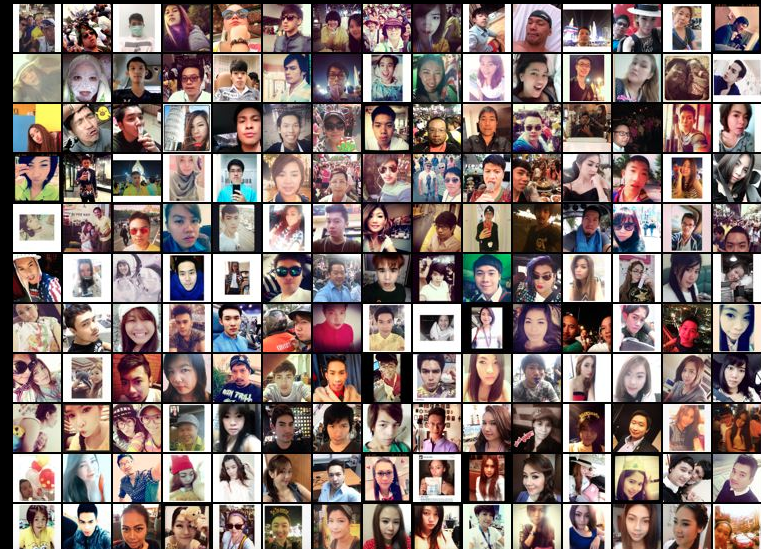
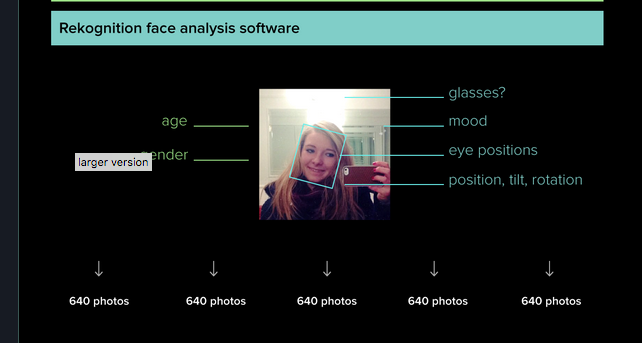
The project also uses a combination of Mechanical Turks and automatic image analysis software to determine patterns. These are screenshots of the description straight from the projects site.
Selfiecity as an Effective Data Analysis Project?
The project is most successful in analyzing the head tilts of the selfie subjects. The imageplot and selfiexploratory features are very successful at visually demonstrating the tilts according to the city. This gives insight into what certain expressions mean according to region. It also looks at other aspects such as smile, gender and age and summarizes what cities reflect what statistic. That being said, a major flaw in the data analysis process is how the photo’s are selected. With approximately 95 million photos and videos being shared on Instagram per day, the project presents a pool of 640 selfies per day and such a small sample size cannot fully represent the populations of Bangkok, Moscow, Berlin, New York or Sao Paulo. The data set is narrowed down so much and because it uses human analysis of the photos that also leaves room for bias due to humans being subjective. By the time the selfies are narrowed down, the pool of selfies is simply not big enough to accurately represent the cities they are trying to.
