Programs and Plugins
Building History uses multiple different programs to power and control the site. According to the site itself, one of the platforms they use to power the website is Omeka, a free digital publishing software created by Roy Rosenzwig Center for history and New Media. They also use Neatline, a project created by the University of Virginia’s Scholar’s Lab, with the use of the NeatlineSimile and WayPoints plugins. The theme of the site is said to be based on a Neatlight theme for Omeka created by David McClure. The last processor that was used was Panzoom a jQuery plugin.
Creation of the Website and Map
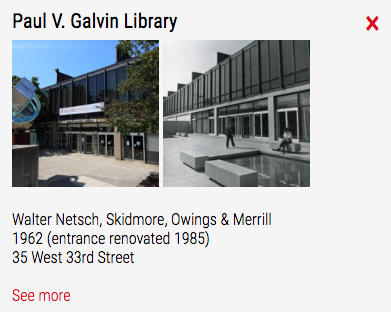
The website is powered by Omeka, a free digital publishing software created by Roy Rosenzwig Center for History and New Media. Omeka is an open source publishing software designed for scholars, museums, libraries, and archives who wish to create and share collections and narratives online. With Omeka as a base, they use Neatline as the framework for the creation of the map of Illinois Tech’s Mies Campus. Neatline is a suite of plugins for Omeka that allow for the creation of interactive visual materials, such as maps, photos, and paintings. The plugin NeatlineSimile is used to create the interactive timeline on the map. The sliding timeline controls the visibility of specific buildings on the map, depending on their erection and destruction. The plugin NeatlineWaypoints allows for the buildings to be clickable “waypoints” that reveals a pop up window with information about each particular building. Finally, the jQuery plugin Panzoom is used to add zoom and pan functionality to the map. The plugin uses CSS transforms and matrix functions, efficiently using the browsers GPU acceleration, allowing for the map image to be smoothly maneuvered around.

Data Collection
The Illinois Institute of Technology utilized manysourcesduring their research to make Building History as complete as possible. Their source page reveals a wide range of source types, from archived news papers such as the Chicago Daily Tribune, press releases for the university, and university bulletins. One of the biggest sources of data they used to build the site’s collection was the University’s very own archives. They also use crowd sourcing to update any information that could possibly be incomplete or incorrect. Under the source list of each building’s page is an email link for anyone who wishes to add to the project, making its creation widely collaborative, though it is unclear how much data was collected in this way.
Integration
The data collected was used in the creation of Building History in a number of ways. Information about a building’s creation and destruction dates were used to plot the visual representation of the building temporally on the sliding timeline. And it’s location was used to plot its spatial representation on the map as well. Additional information about the history of the buildings were added in the pop up pages that appear when a building is clicked on. The pictures that were obtained are also integrated in the individual building pages, many of which show the buildings in various stages of its creation, existence, and demolition.
