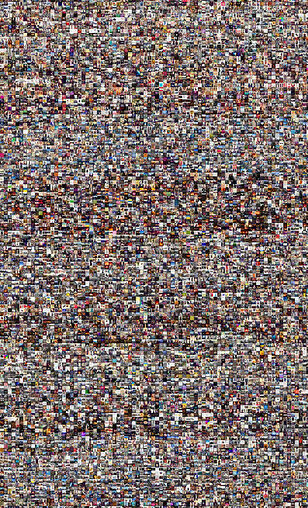
“The Everyday project” utilizes a data visualization tool in order to find optical patterns across Instagram posts during the five days of the revolution. By utilizing a data technique called the team coins as “flow” it is possible to see the bigger picture of what all the photographs look like over the last six days of the protest and how people’s behavior changed as the situation developed. It creates an opportunity to visually comprehend what all the data looks like at once and to see how it all fits together.
Data visualization can also help meet the goals and values of work within digital humanities. By creating a way to visually explain data, people who may not be as familiar with the discipline may have an easier time understanding findings across projects in the field. In this way it has the potential to make digital humanities research more open and transparent to the public.