The Mapping Inequality project from the University of Richmond which details redlining is similar to my school funding map because both use interactive digital maps to visualize inequities across neighborhoods, making hidden patterns of inequality visible to the public.
Both projects connect historical and social context to data, helping users understand how systemic policies affect communities over time.
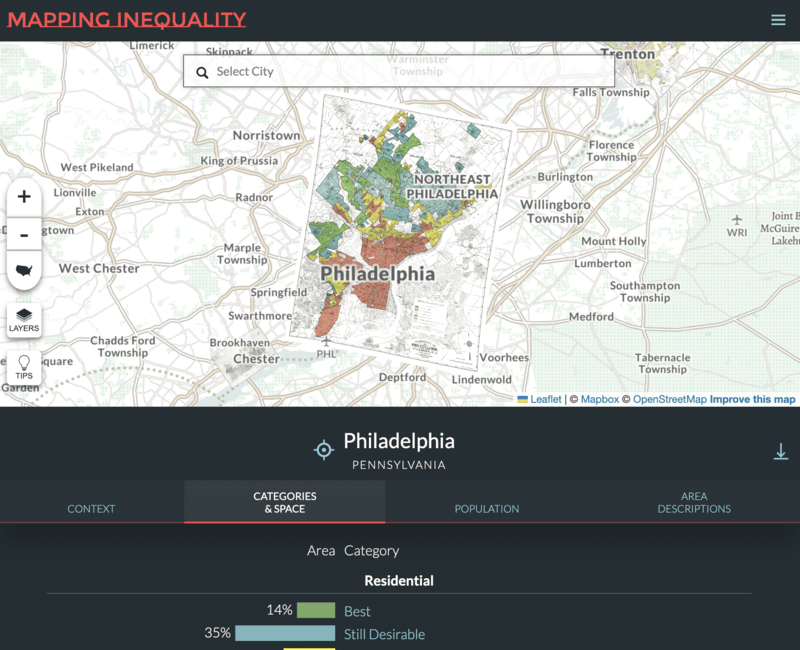
The key difference is that Mapping Inequality focuses on historical housing discrimination and its long-term effects, whereas my project focuses specifically on current school funding disparities and their direct impact on educational opportunities.
The Anti‑Eviction Mapping Project is similar to my project because it uses interactive maps and data visualization to make systemic inequities visible, combining public records with narrative context to highlight how policies affect communities. Both projects aim to empower local residents by providing accessible tools to understand and respond to inequality.
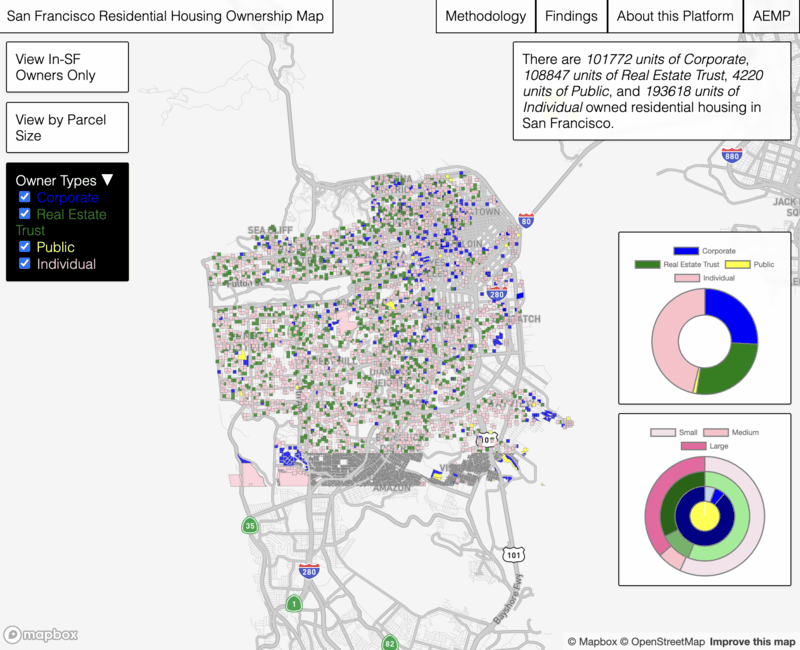
The key difference is that AEMP focuses on housing displacement and gentrification, while I focus on school funding and educational equity.