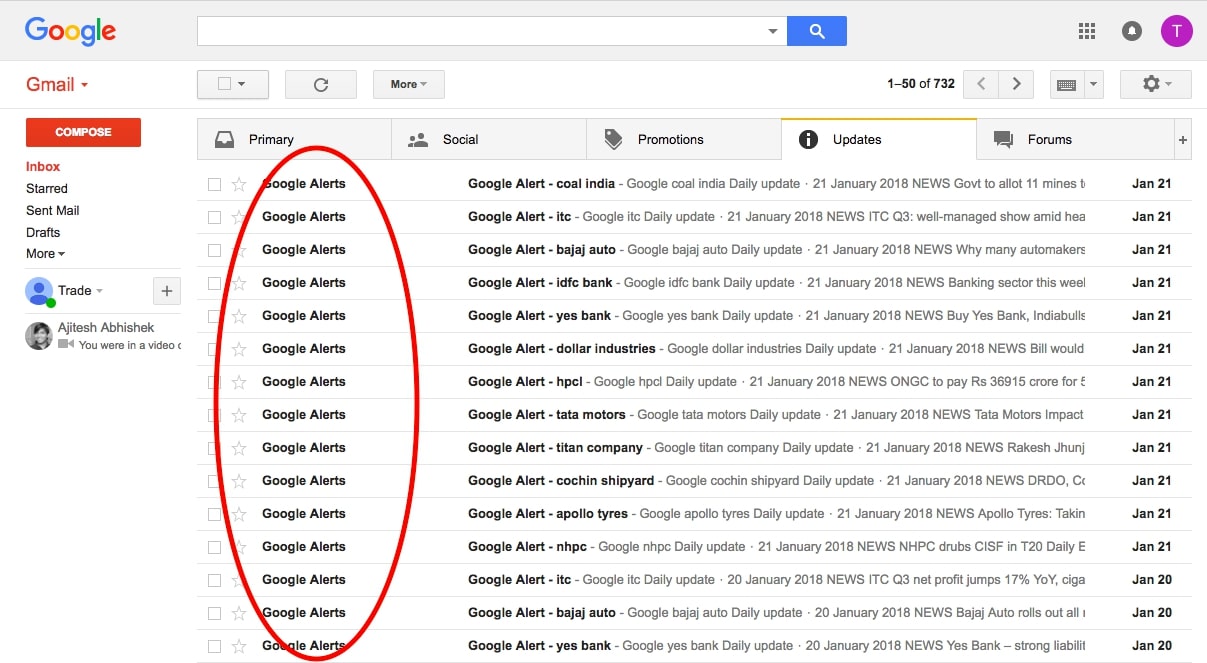
To get data, “Meltwater & Google Alerts are filtered into an Alerts sheet.” Google Alerts are a type of alerts through Google that will flag and send you an alert every single time it finds something on the web that you are looking for. In this case, a Google Alert was set that whenever an article with an incident of police violence was published, people from Mapping Police Violence would get that alert to go look at the article. Outside of this project, Google Alerts can be used for various reasons and by various people. I think it could be particularly useful for those in business to keep up with the news in their industry or mentions of their own businesses on the internet.
Meltwater is an app that has a built in alert system. Primarily, Meltwater and the alter system is for “PR and marketing professionals” to keep updated. But Mapping Police Violence uses it to get alerted of instance of police violence. Similar to Google Alerts, Meltwater “sends key real-time insights about your brand, competitors, industry trends, either to your email inbox or to the Meltwater App.” Out of all the aspects of Meltwater alerts, Mapping Police Violence probably uses the “Every Mention Alert” for the table. The “Every Mention Alert” “is sent when a new mention appears in your saved search.”

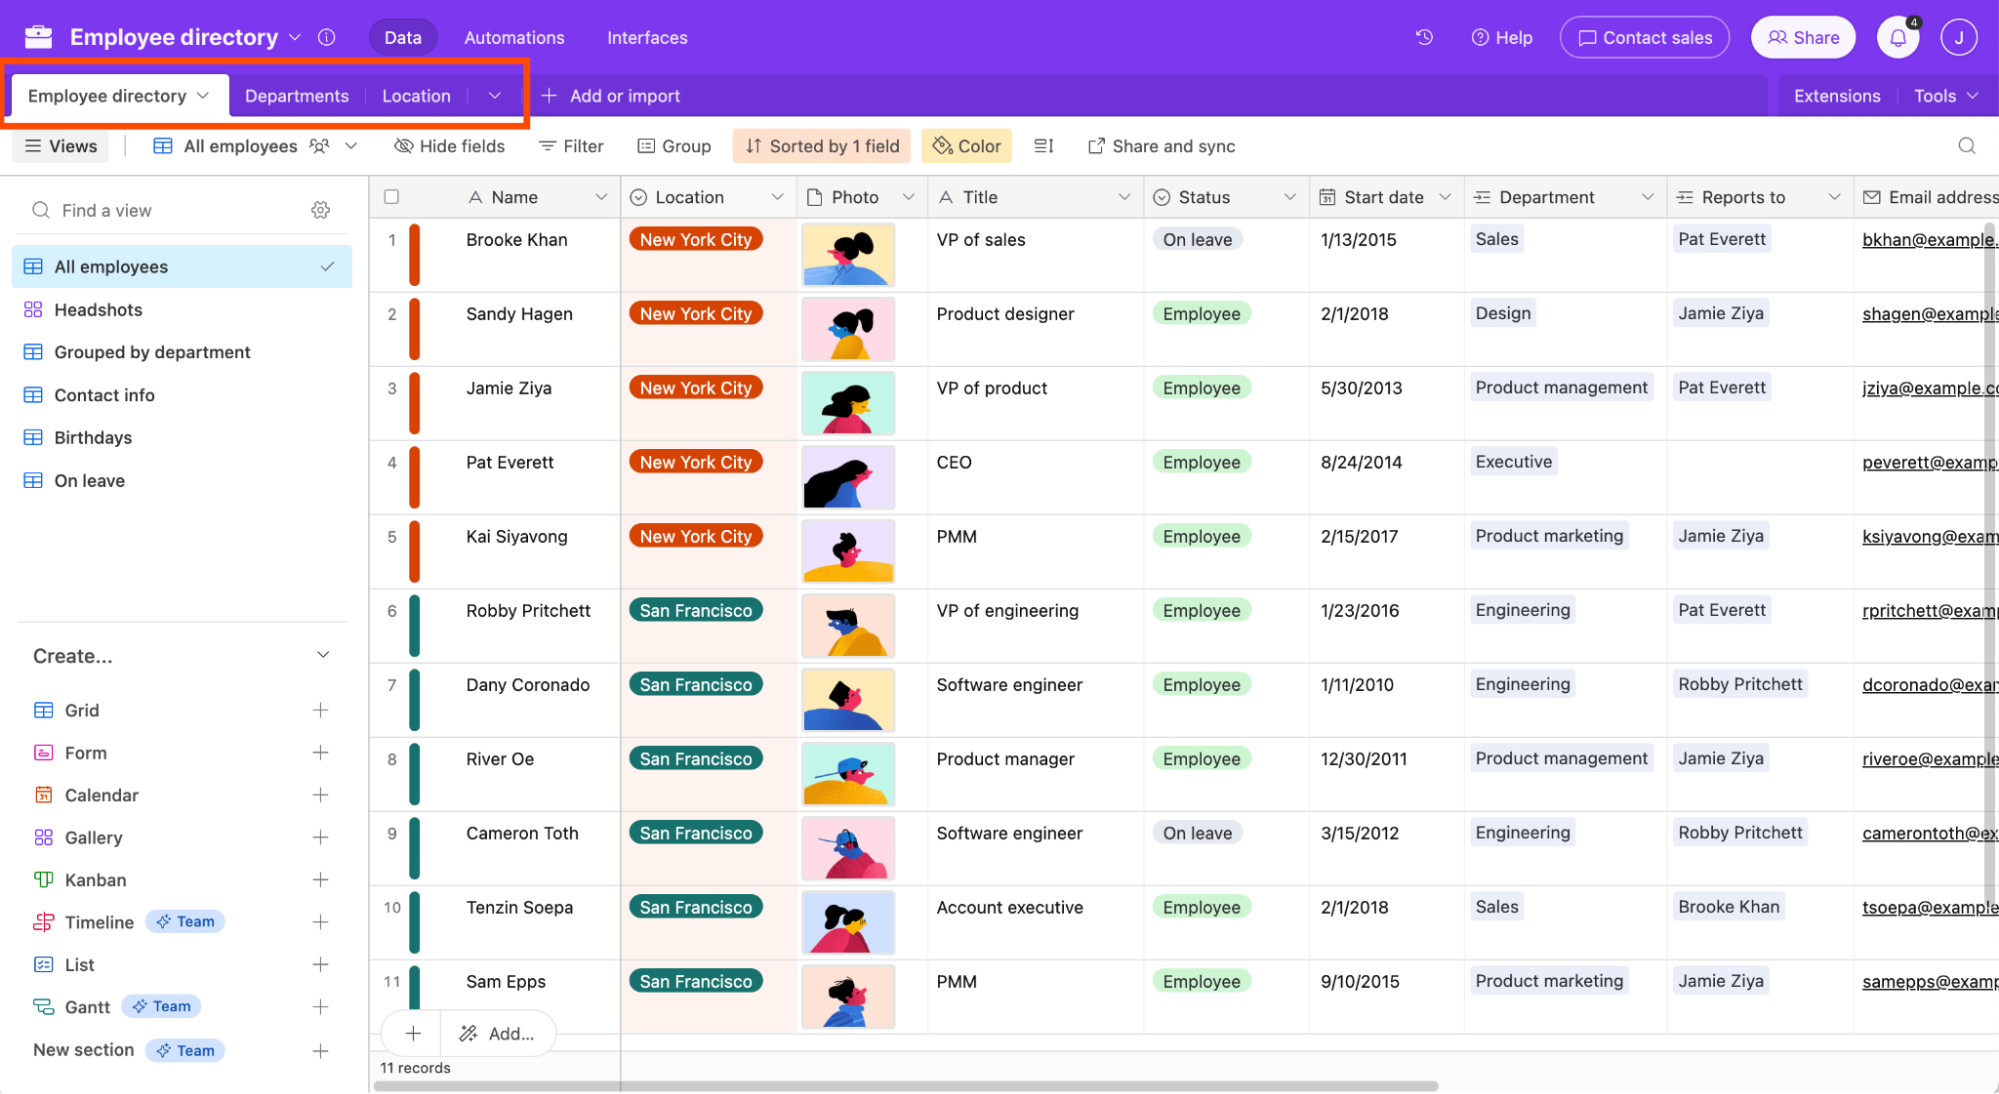
To process data, an Airtable is used to display the data. Airtable is a “cloud-based platform for creating and sharing relational databases.” While it looks like a spreadsheet, it is actually a database and shows the relationship between data. Mapping Police Violence uses it to store the data about all the victims of police violence. But Airtable also includes automations which Mapping Police Violence uses to go through the data and separate it. Some of the automations Mapping Police Violence uses are to deal with “article duplication,” “removing non-US sources from Google Alerts,” and “automatic article assignment to research coders” among other abilities. Outside of this project, Airtable can be used in the marketing field and to keep track with businesses. On the website, Airtable is described as having “powerful solutions for product, marketing, and more.”
There is a full document explaining the data and methodology of Mapping Police Violence. This document does explain the tools that are used in the project. However, there is not an in-depth description of how the tool is actually used or what it exactly is being used to do. There is also not discussion of how the data visualizations on the website are created. Instead, the document also focuses more on the coding end of things and how to input data into the Airtable.
The tools used in this project do follow the best practices for the most part. Google Alerts are a completely free and open tool that anyone with a Google account can use. But Meltwater is not a free service. It doesn’t even offer a “self-serve free trial,” so it does not completely follow the best practice of tools being free and open. Both of these tools, though, seem to be used for searching news articles, so it does seem to work out well that Mapping Police Violence uses them to specifically finds articles that contain incidents of police violence. But there is a potential problem with this method of using tools since “the closure of newsrooms across the country” affects the ability of Mapping Police Violence to track police violence using local news sources and the amount of news articles Google Allerts and Meltwater will bring up. Airtable does have a free version for “individuals or very small teams,” so it does follow the best practice of tools being free and open. Airtable is also being well utilized since it allows for the data of Mapping Police Violence to be shared easily.