Since the main audience for the project is researchers, Mapping Police Violence helps researchers study and understand police violence in the U.S. Researchers like Susan Olzak can use Mapping Police Violence to further study the issue of police violence and use it as a source. In her article, “Does Protest Against Police Violence Matter? Evidence from U.S. Cities, 1989-2019,” she uses Mapping Police Violence as a source of data along with Fatal Encounters to “create an event-history dataset to examine the effect of prior protests on the rate of founding a CRB.” CRB is a “Civilian Review Board” who reviews incidents of police mistreatment. But Mapping Police Violence allowed for her to access data on police violence from 2013-2019. This is especially important since police departments themselves tend not to publish data on police violence and the Law Enforcement Management and Administrative Statistics can have “discrepancies in whether reports concern alleged or verified complaints.” So, Mapping Police Violence is an important tool for researchers who want to study police violence or a topic connected to police violence. This importance has also grown since the other two big databases, Fatal Encounters and Fatal Force, have both stopped updating their databases.

Susan Olzak is Emerita professor of Sociology at Stanford. She mainly researchers “ethnic and racial conflict, collective action, and social movement organizations.”
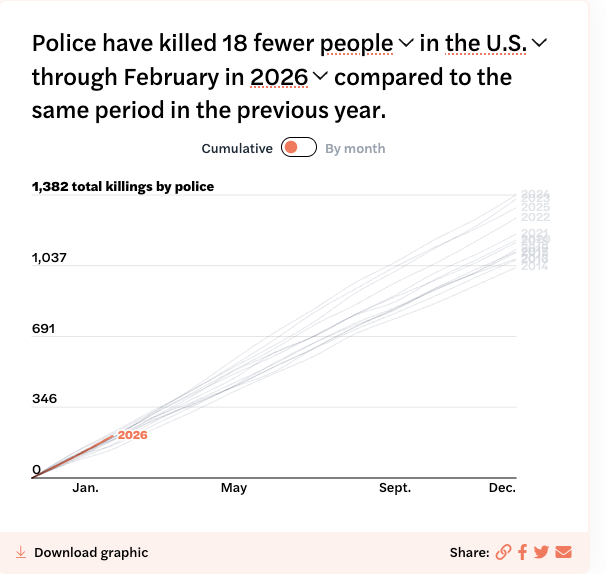
For activists, Mapping Police Violence offers easy downloaded graphics and numbers to share with people. Under each data visualization on the website, there is both the option to download the graphic and share it on social media. So, Mapping Police Violence allows activists to spread awareness of the issue of police violence by providing graphics for people to share and providing updated statistics for people to use when talking about police violence.