On the Mapping Police Violence website, under the Data and Methodology section, there is a summary of the process that is used to collect and process data. There methodology and methods used in the project are public and available. So, there is documentation that is used to explain the methods.
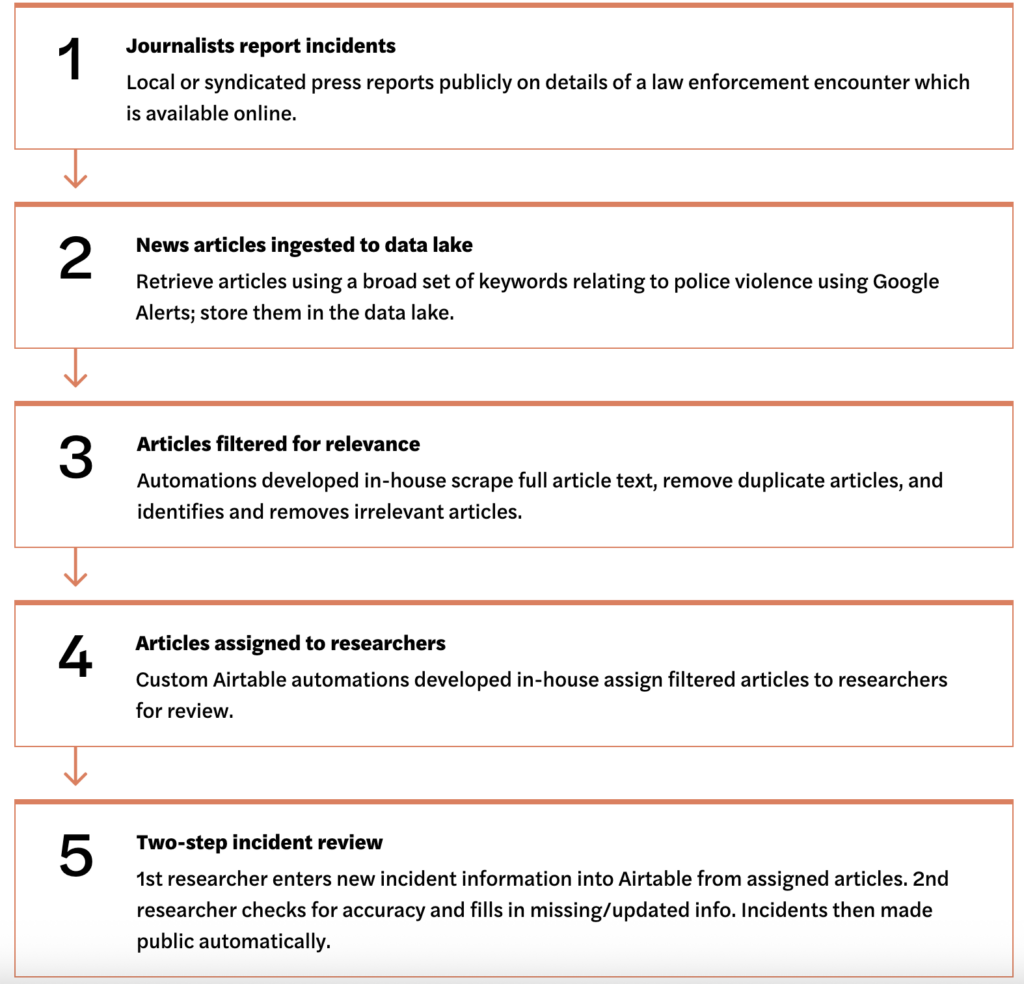
The first step of the process begins with journalists writing about police violence in their local area. These journalists would typically report from police blotters in their neighborhoods about the police violence in the area. But this means that all the data from Mapping Police Violence requires there to be a news article about the incident. It’s not the most effective way to gather data since there could be instances of police violence that are not being reported.
But once the article is published, the Google Alert or Meltwater alert automatically takes the article and the incident into an Alert Sheet. The Airtable automations filter through the alerts and gets rid of duplicate articles or those not in the US. The Alert Sheet “gets automatically updated every morning and automatically assigns the alerts for researchers to review.” Researchers first review the alert to determine whether it is relevant to police violence or if it already exists. If it is not relevant, reviewers “will mark that they reviewed the alert and proceed to reviewing the next alert.” If it already exists, they will update the record if there is any new information. If it doesn’t exist, then reviewers will create a record on the Airtable and fill out information about the person and the incident.
After the first reviewer, there is a second reviewer who has to confirm and review the information in the record. The second reviewer will “search Google News” to find the latest news articles with the newest information about the incident. If they do find new information, then they will add it to the record.
Once the second reviewer reviews the record, the first reviewer marks it down as being reviewed by the second reviewer and it will automatically be published to the platform.
This project does follow best practices when it comes to methods, for the most part. It has an entire section and document dedicated to explaining the process that anyone can access. This document does walk through the process of how the data is collected, reviewed, and published. But it does not talk about how the visualizations are created at all. It does not list a tool or explain how the data goes into creating the data visualizations on the website. So, it is not completely following best practices since it is missing the crucial part about how the data visualizations are created.