The data for this project is every single person who was killed by police violence. On the website, the data shows up as apart of statistics. But on the data page, it’s shown as apart of a spreadsheet where every person is listed. The spreadsheet includes a lot of information about the person, the place where it happened, the police department involved, the circumstances surrounding it like if the person was allegedly armed or not, and more.
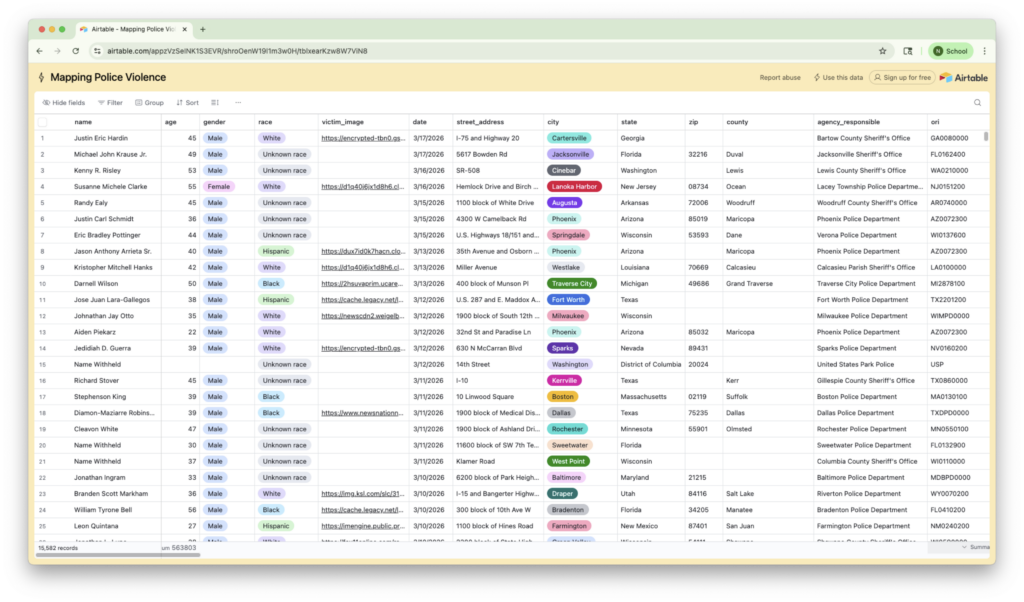
Mapping Police Violence uses “Google Alerts as our primary method for detecting news media mentions of police violence.” Google Alerts are a tool from Google that can be set up to send a link about any page you want it to. In the case of Mapping Police Violence, Google will send out an alert to them when it detects any news article mentioning police violence. From there, the article from the alert is placed in the Airtable and a reviewer fills out the information from the article into the table. There is then a second reviewer who double checks that information and adds any new information if there is a more updated news article.
Then Airtable is an example of the output of clean data. The Airtable is available for anyone on the website to look at and download through the “View the data” link which will take you right to the Airtable. But even though it is a live tracker, data is not immediately shared. Instead there needs to be a “sufficient amount of time to pass prior to publishing incidents that may misrepresent the true details of the incident.”
The ultimate end result is that the data is output as different forms of data visualizations on the website. These visualizations range from a calendar to show time and all the days that police violence have happened to a map of the US to show the places where police violence happens the most. All of these data visualizations are from the data collected from the original Google Alerts in the Airtable.
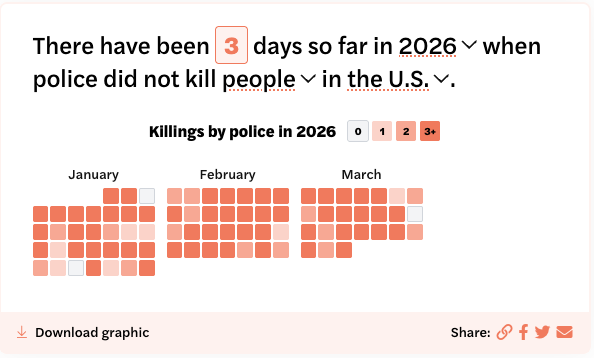


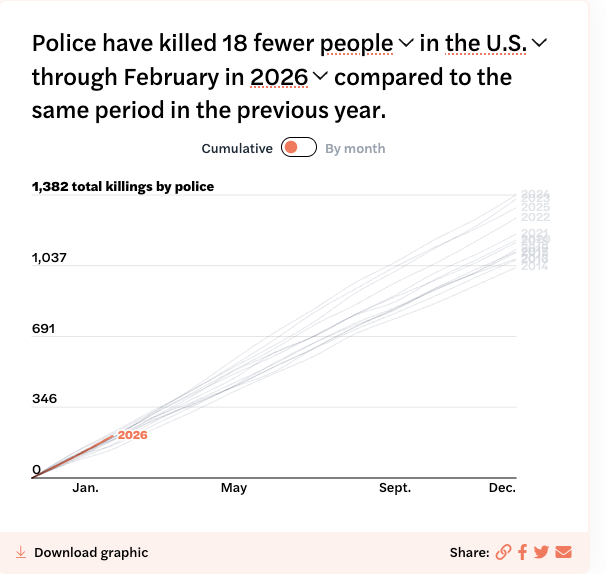
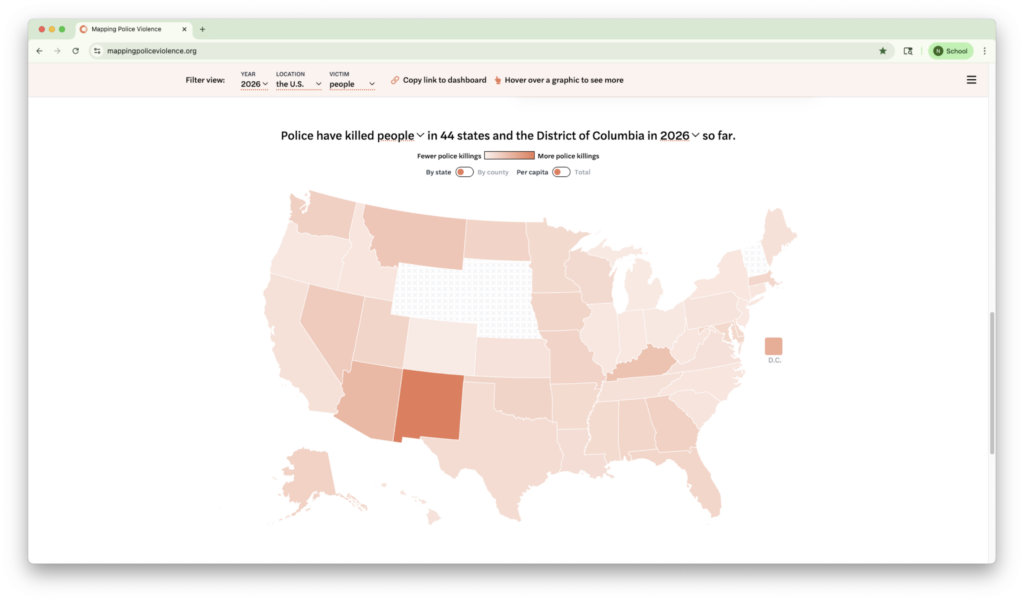
The project does follow the best practices when it comes to data. It is pretty clear about its sources. The Airtable includes links to the news articles where the information was originally found. It is also ina format that is very accessible and can be opened very easily. The data can also be easily downloadable from the Airtable, so it does follow best practices.