Mapping Police Violence is important because it is still such a prevalent issue in 2026. From the 2025 year-end report, there was a “5% decrease from 2024” but the number of people killed by police violence was “at least 1,314 people in the United States.” Even as of March 24, 2026 when Mapping Police Violence was last updated, “291” people have died and there has only been “3 days so far in 2026” where people were not killed from police violence. Because of Mapping Police Violence, people are able to keep updated on just how many people are killed from police violence and have visualizations of just how deep the problem is. Without it, people may not be aware of just how widespread the problem is and only focus on what their local news is.
It’s also important that Mapping Police Violence tracks the race of the people who are killed by the police because it offers an opportunity to see just who is getting more affected by police violence. Native Hawaiian and Pacific Islanders, Black people, and Hispanic people are the ones who are most likely to get killed by police violence. Being able to visually see the comparison emphasizes also how police violence affects people differently based on their race.
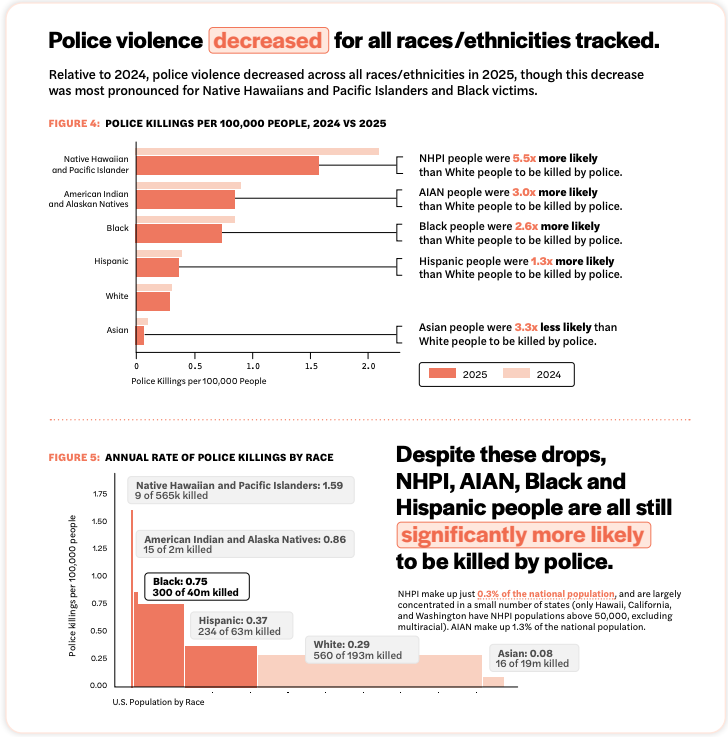
This does reflect the values of social justice in the humanities because it is showcasing the unequal treatment of people of color by police. It is highlighting how police violence disproportionately affects people based off of their race. This inequality is being acknowledged through the project’s comparison of how each race is affected by police violence.