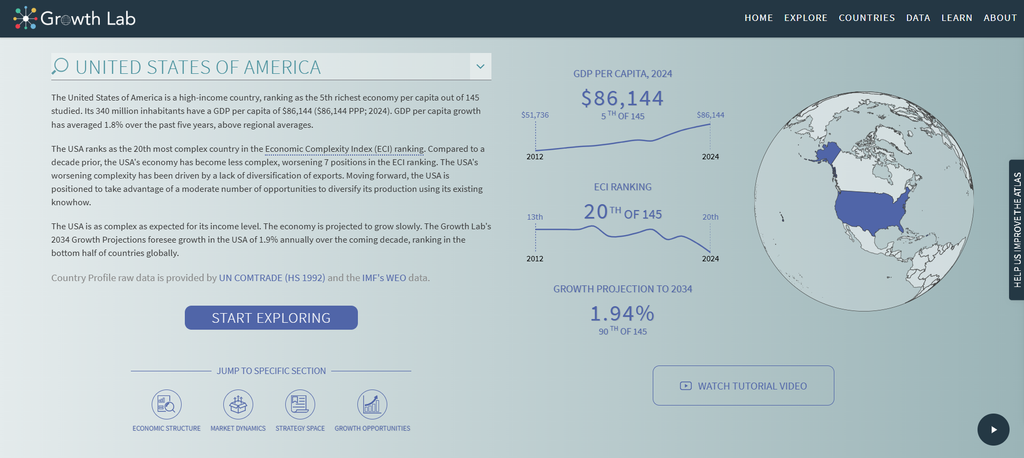
“The Atlas of Economic Complexity“, written by the atlas team at Harvard, is a great project that displays economic information for every country in the world through the use of digital methods. The goal of this project is to gather research in an effort to allow people to explore global trade flows across markets, track these dynamics over time, and discover new growth opportunities for every country. To exemplify and present the research they gathered, they came up with many different unique and interactive methods.
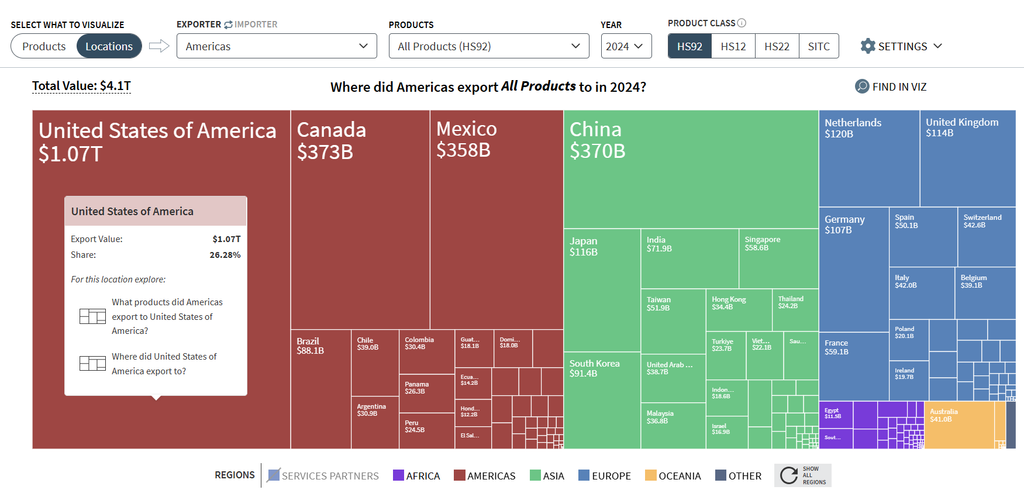
This screenshot shows one of the interactive ways the Atlas decided to show where the Americas exported all of their products to in 2024. Without even hovering your mouse over these boxes, they show the drastic difference of money exported between different countries simply based on how big or small they are. Hovering over the individual boxes allows you to see the exact amount exported and gives you the opportunity to click on the box to see the exact product groups that were exported into and out of the United States.
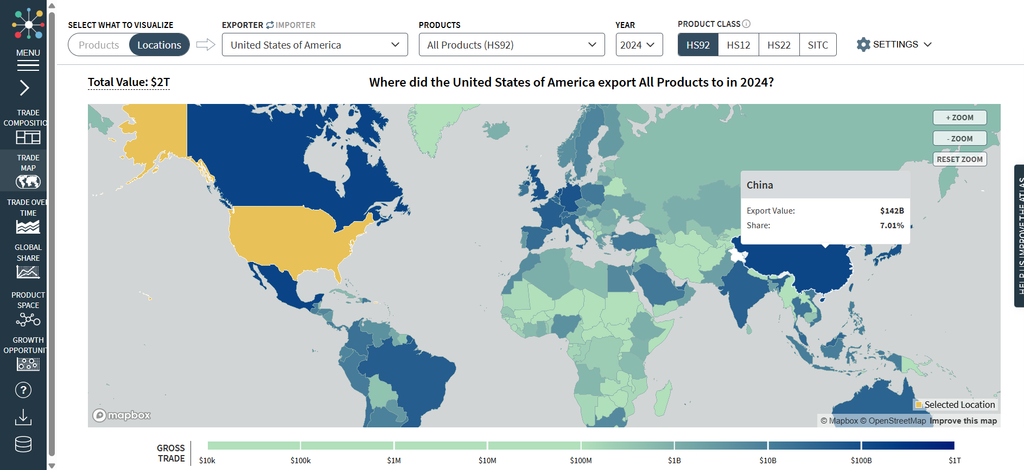
This screenshot shows the same information in a completely different, interactive way.
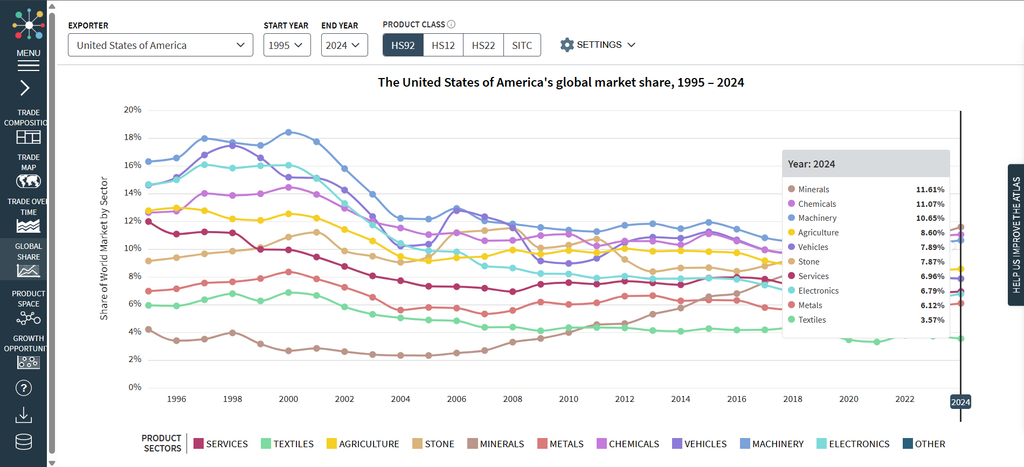
This screenshot shows the USA’s global market share across several different product groups and visually shows how these percentages have changed over the past 30 years. Hovering your mouse across the graphic allows you to see the market share percentage of these different groups.
This screenshot shows a completely different tab in the Atlas that allows you to see an economic overview for different countries around the world. After selecting the country you’d like to take a look at, the Atlas will present statistics such as the GDP per capita, ECI ranking, and growth projection to 2034. Upon clicking, “START EXPLORING”, a screen will pull up that shows the exporting information stated above.