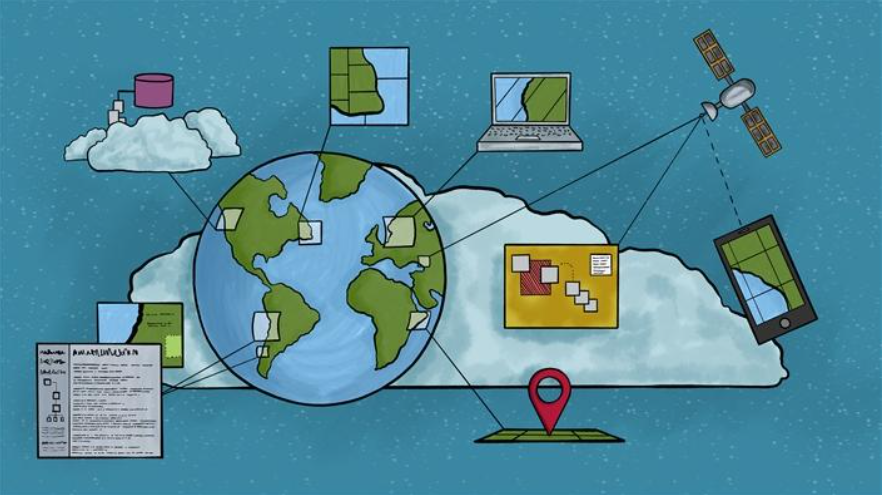
The tool used mainly in this project is digital mapping. Digital mapping, a common tool used in the digital humanities world, is the process of using geographic data to get a point across. The map is used to showcase the data points and findings, and the data itself is placed on the map based on the different statistics in each area on the map. For example, in this project, the differing findings of the residential data of certain towns and how Redlining caused them the differing data, and its effects on the area are displayed. With the use of the maps, the data is visualized and much easier to understand and analyze. In this project, it is the main tool used to display the data, and although there are many uses of digital mapping elsewhere, it is mainly used to showcase data in a similar way and make the data easy to understand and effective. Specifically, a service called Mapbox is used to create the maps, which provides custom online maps, especially for websites. Mapbox uses open data services mainly (OpenStreet Map, NASA), but also has contributions from paid services (DigitalGlobe), and it began as open source, since becoming a proprietary software. Simply put, Mapbox is a service that allows you to create custom maps and implement them into a website or application, such as this project does.