
What is “On Broadway?”

- This Project uses data to create a visual representation of everyday life on Broadway in New York City
- Collects, shows, and layers different types of data
- Transforms this data to show how people interact with the city in real time
- Focuses on one street to reveal patterns in culture, behavior, and activity
Created By
Developed by Lev Manovich and the Software Studies Initiative in 2015
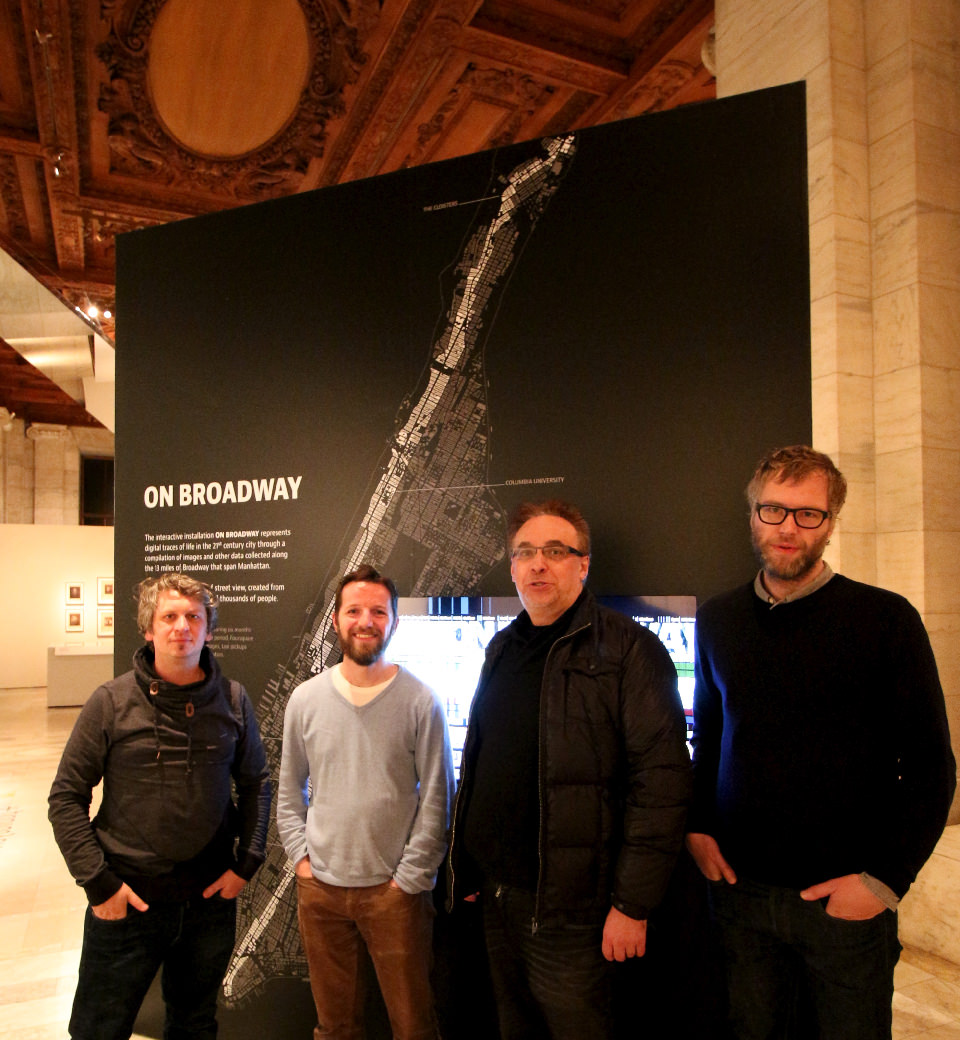
Location
New York City

Focus
Exploring urban life through data and digital visualization

Audience
Researchers, students, and anyone interested in cities, data, or digital media
Not Just a Map:
The project collects, shows, and layers different types of data to create a visual representation of urban life.
It layers multiple types of information to show:
- Where people are most active
- How different areas of the street feel culturally
- How activity changes over time
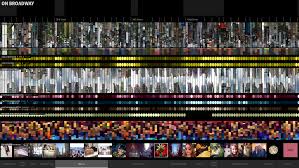
Data sources include:

- Instagram posts (visual culture & aesthetics)

- Twitter posts (opinions & communication)

- Taxi data (movement & traffic patterns)

- Income data (economic differences across areas)
Importance:
🏙️ Understanding Cities
- Cities aren’t just made up of buildings and streets
- They are shaped by people and everyday activity
- Movement and interaction help define urban spaces
- Focuses on what’s actually happening in real life

📊 Using Data to Reveal Patterns
- Data helps uncover patterns you normally wouldn’t notice
- Shows how people move and interact over time
- Makes invisible trends visible and understandable
- Offers a new way to study and experience cities
