
What does this project aim to do?
1. Visualize City Life
→ Students & General Public
- Helps students understand patterns in everyday behavior
- Lets the public see how people move and interact in the city
2. Combine Data Sources
→ Researchers
- Allows researchers to analyze patterns across different datasets
- Creates deeper insights into how the city functions
3. Make Data Interactive
→ All Audiences
- Students, researchers, and the public can explore data themselves
- Makes information more engaging and interactive
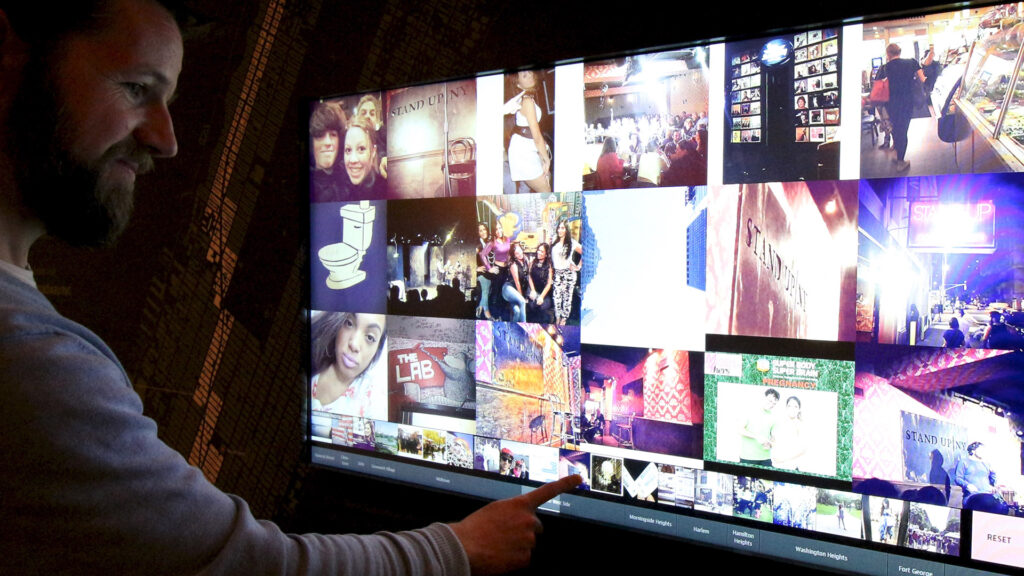
Who is it for?
Students
Understand patterns in city life
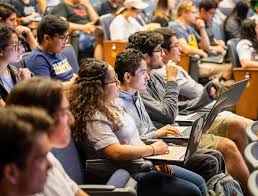
Researchers
Analyze + gain insights from data

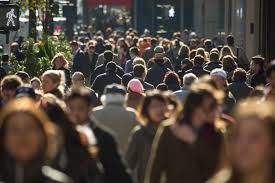
General Public
Explore the city interactively
DH Connection:
Digital Humanities Goal
- Makes complex data easier to understand
- Focuses on culture and human behavior
- Uses digital tools to study real-world experiences
- Turns information into something visual and interactive
How This Project Connects
- Combines multiple types of cultural data
- Visualizes patterns in everyday city life
- Allows users to explore instead of just read
- Transforms Broadway into an interactive experience
Best Practices Assessment:
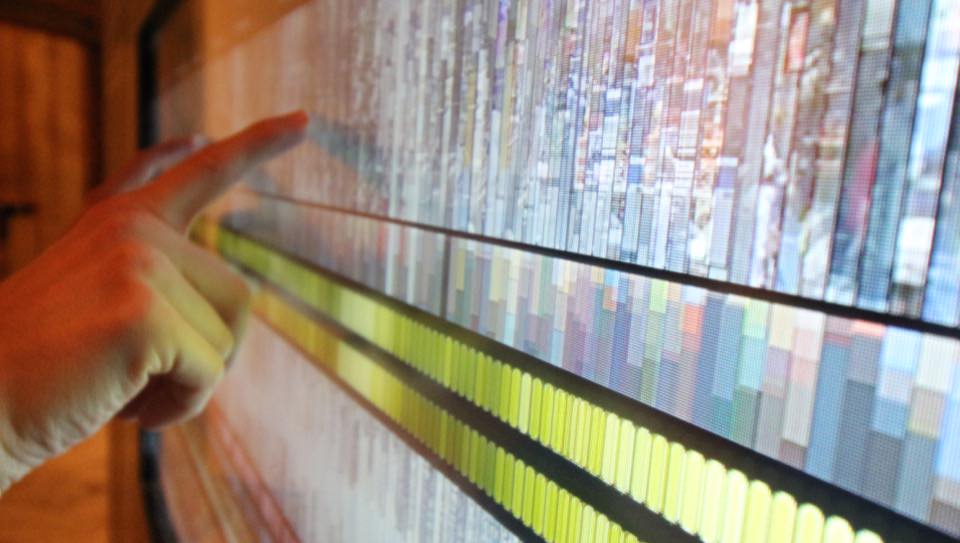
- Clearly organizes information in a structured and easy-to-follow way
- Effectively uses data to represent cultural and human behavior
- Combines multiple data sources to create deeper insights
- Makes complex information interactive and accessible to different audiences