

The On Broadway Project focuses on Broadway, a street that runs over 13 miles through Manhattan and connects multiple neighborhoods across the city.
The project uses data to understand how people interact with this space and how activity changes along the street.
Data Sources:
The data used in this project comes from a combination of social media platforms, public datasets, and city based records
- Instagram images (visual culture + behavior)
- Twitter posts (public interaction + communication)
- NYC taxi data (movement + activity patterns)
- Income and demographic data (economic patterns)
- Google Street View imagery (spatial + visual representation of Broadway)

Analyzed Data:
The project collects raw data and then processes it to identify patterns in how Broadway is used
- Images are analyzed to understand visual culture and representation
- Location data is used to track movement and activity
- Social media data reveals patterns in interaction and engagement
- Economic data provides context about different areas

Data Characteristics:

- Visual (images from social media platforms)
- Numerical (data like taxi rides and income levels)

- Location Based (tied to specific points along Broadway on google maps)
Output:
The project transforms this data into interactive visualizations that allow users to explore Broadway in a new way
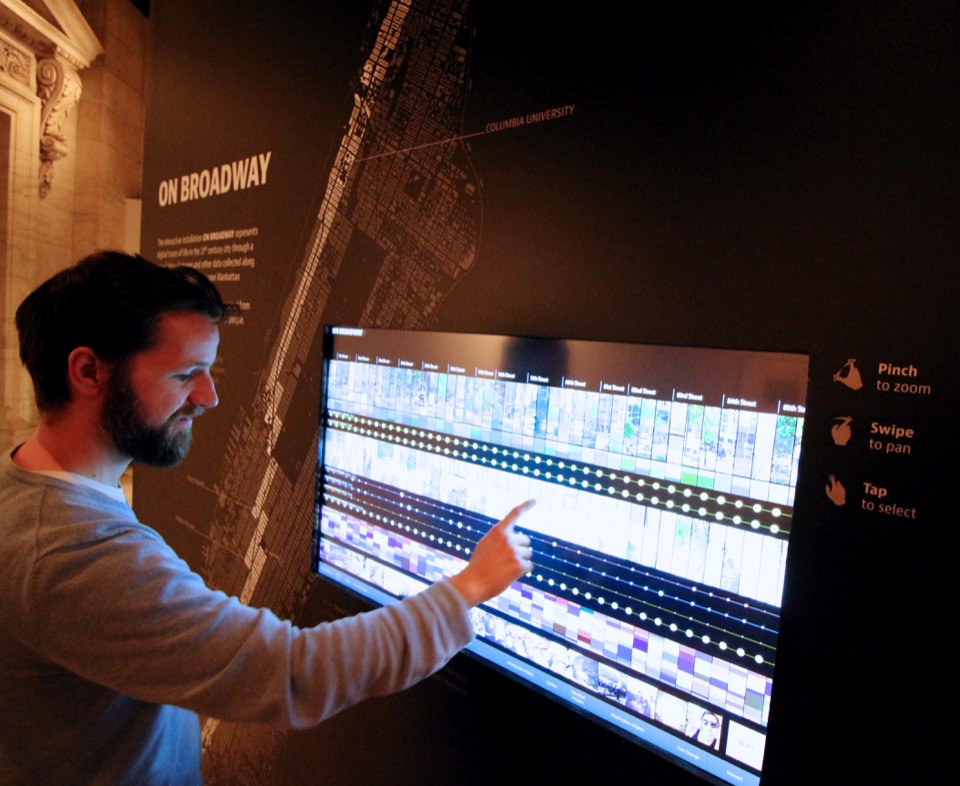
- Interactive maps and visual displays show patterns across the street
- Users can explore data instead of just reading about it
- The project presents data as a visual and artistic experience
- The data is primarily presented through the platform and is not always available for direct download, emphasizing exploration over raw data access
- Google Street View based visualizations allow users to move through Broadway and explore changes along the street
Best Practices Assessment:
- Uses different types of data to give a more complete view of Broadway
- Connects data to real human behavior and activity
- Turns complex data into visuals that are easier to understand
- Integrates tools like Google Street View to connect data with real world spatial experience
- Makes the project more interactive instead of just informational