
Key Tool used in Project:
On Broadway Interactive Application
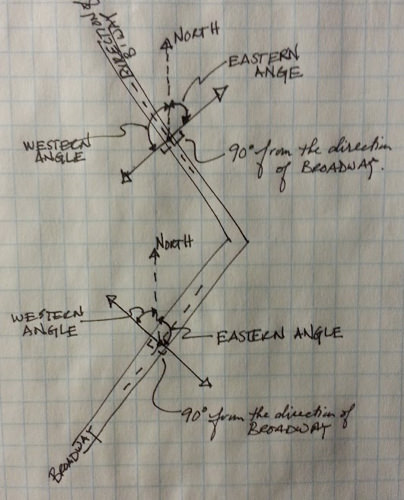
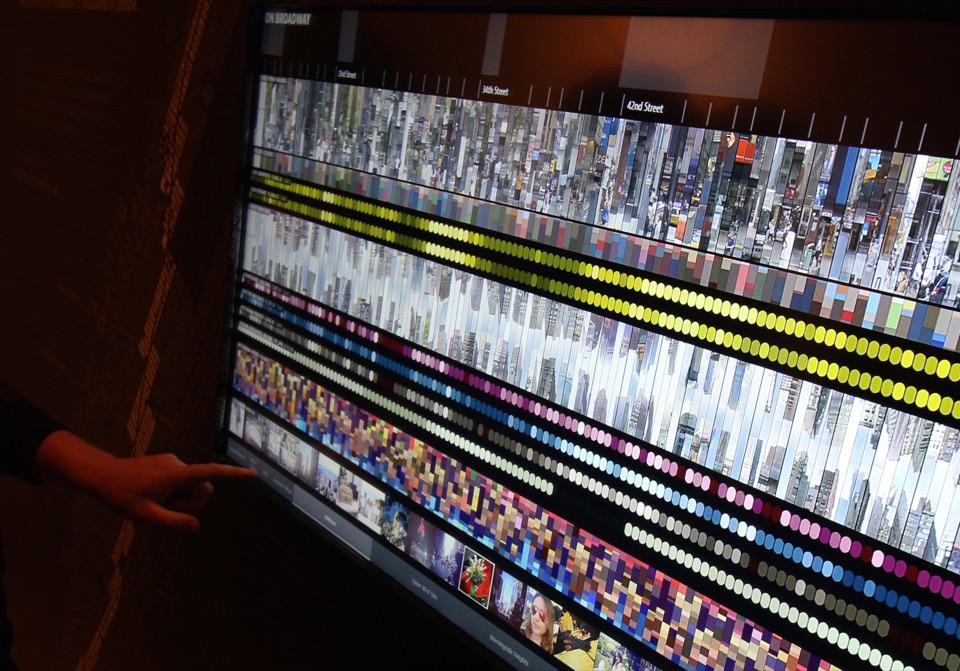
The On Broadway Project uses its own interactive web-based application to collect, organize, and display data along Broadway.
What the Tool Does:
- Integrates data from Instagram, Twitter, and Google Street View
- Maps activity and patterns along Broadway
- Allows users to explore the street through interactive visuals
- Combines multiple datasets into one platform
How the Tool is Used:
- Social media data is pulled to show human activity and engagement
- Google Street View is used to visually navigate different locations
- Data is layered to show patterns across neighborhoods
Use Beyond This Project:
This type of tool could be used in other digital humanities projects to:
- Analyze cultural patterns in different cities
- Study how people interact with public spaces
- Visualize historical or social data in an interactive way
Best Practices Assessment:
- Uses a custom-built tool instead of a generic platform, making it more specific to the project
- Combines social media and mapping tools (like Google Street View) to connect data to real locations
- Lets users interact with the data instead of just viewing it
- Applies the tool in a way that clearly shows patterns in human behavior and space