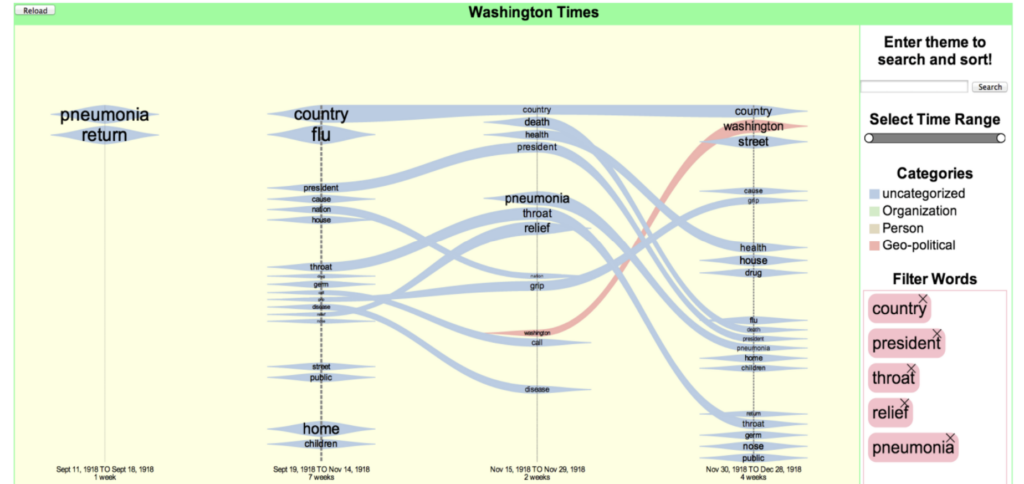
This picture above is a ThemeDelta visualization for the Washington Times newspaper in 1918. Despite user interaction where the user is searching for specific terms, which are the red labeled filter words. Which shows the sentiment of the influenza pandemic through five newspapers.
In the end, the research team dove deep into all these different newspapers/articles reading them repeatedly, analyzing, and “developing a feel” of how these papers covered the epidemic. Topic modeling, analyzed in a more focused analysis, illustrates three broad trends in how weekly newspapers reported on influenza. Also, it’s the most effective method for identifying broad trends and guiding future research for textual analysis.
They also allowed for researchers to identify significant differences in the reporting styles in both the Weekly Newspaper Case Study and Daily Newspaper Study by using tone analysis. This was done by identifying patterns, themes, and rhetorical features. Close readings enabled researchers to ask question on confusing data mining results. Last, the tone classification was used to detect tone necessitated editing of poor OCR transcription and then coding of the resulting sentences according to tone. researchers coded cleaned sentences, reading each closely and deciding which tone to assign it to. But also brought insight on how newspapers shaped the meaning of the epidemic.