Selfiecity selfies (self-portraits) taken in various locations and analyzes the facial features, poses, and demeanor of individuals and what conclusions can be drawn from this information. The information is displayed on Image Plots. There are artists on the team and the people who made the image plots – accurately represent large amounts of information. It is not just a bar chart, but a bar chart that has the underlying data that can be accessed and interpreted in minutes.
Http iframes are not shown in https pages in many major browsers. Please read this post for details.The graphs are interactive and made up of selfies. But that’s not Selfiecity’s only image plot, in fact, they have a wide variety of ways to interact with the information in terms of location, style of selfie, features– as shown below.
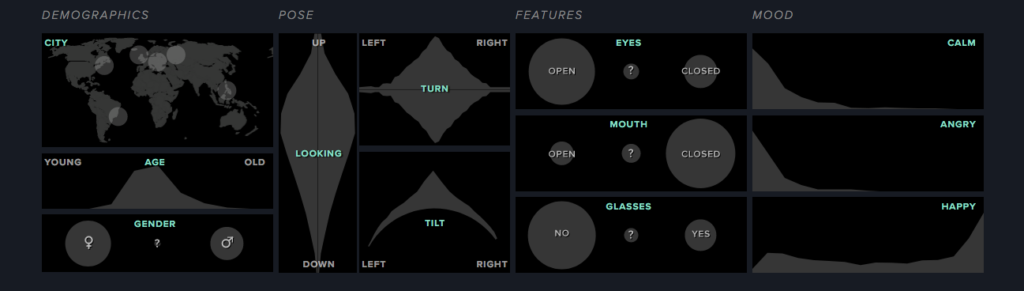
Futhermore, the site breaks down not only location, age, gender and location but also the facial features, pose, and emotion of the photo.
Much of the Methodology is explained here. Instagram was the platform where public selfies with various location tags were collected. To help collect data about the images, the team used Amazon Mechanical Turk, described by Amazon as a, “crowdsourcing website for businesses to hire remotely located “crowdworkers” to perform discrete on-demand tasks that computers are currently unable to do. It is operated under Amazon Web Services, and is owned by Amazon.” Mechanical Turk avoids confirmation bias because it prevents creators of selfie city from having to interpret their own data. This can often result in researchers affirming their own hypothesis.
Mechanical Turk workers verified that the thousands of photos were single person selfies. Then three different Mechanical Turk workers (more skilled “master workers”) estimated the age and gender of the individual. This is important because every piece of data has a majority opinion. Three people had to agree or at least two over one. This is the best practice in the social sciences.
The facial features identified, such as if the eyes were opened or closed, was determined by an automatic face analysis based on an algorithm. This face analysis software was not named by Selfiecity. Finally, one or two project team-members manually checked the work of the Mechanical Turk workers and the algorithm.
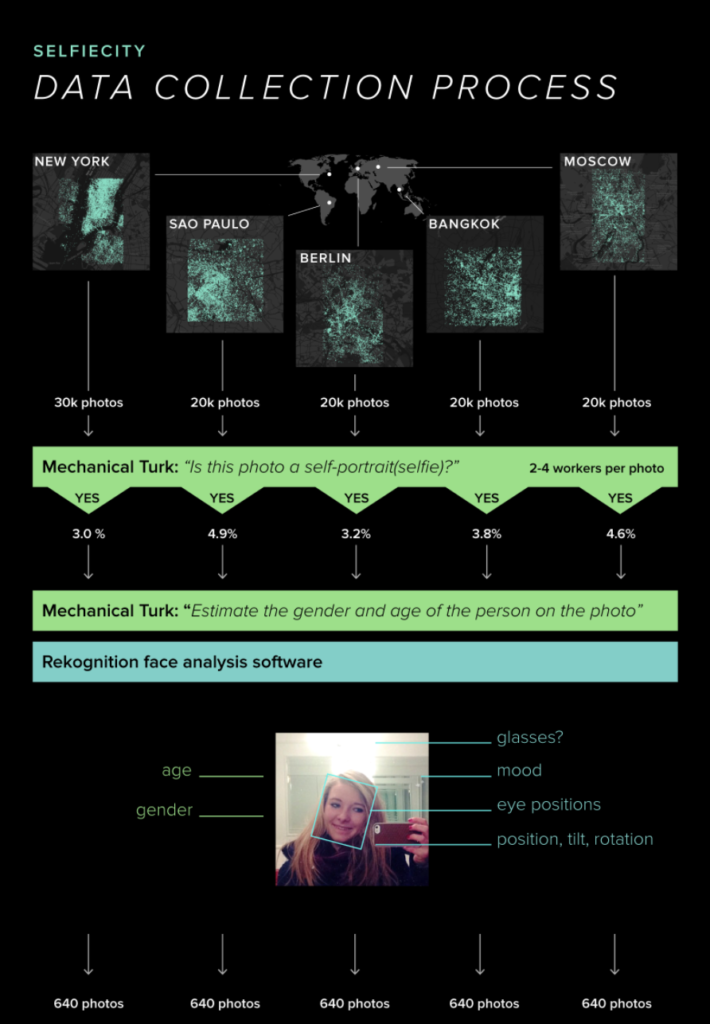
At the bottom of the site, there are a series of blog posts One specifically, titled “The Design of Selfiecity” discusses the process of data collection. Data was pulled from GNIP
The interactive graphs are Scalable Vector Graphics (SVG) meaning a third party software was not used. Selfiecity built their website and interactive graphs using CSS (Cascading Style Sheets) specifically html. They did not use a custom design website like WordPress , but built it piece by piece so they could tinker with every aspect of it. Moreover, using CSS and html, means other people can embed selfiecity’s information into another site. CSS and html are more transparent than a pdf because a pdf is closed. In this way CSS and html are more transparent because other people can use it. Yet, to find this information, it is necessary to access the html page which is not necessarily common knowledge to people with no experience building websites.
Selfiecity is transparent about their means of data collection. Their construction of the site using html makes it accessable to others to duplicate but only for people who understand how to find this information, as it is not outright stated.
