Renewing Inequality is an incredible project for the digital humanities. The goal of this project was to present the details of federally funded urban renewal projects from 1950-1966. Part of this goal was to show the relationship of these urban renewal projects and compare them to the race of the families who were relocated. By using G.I.S. (Geographic Information System) technology the project was able to visualize and show the displacement of families in the 1950’s from the government projects. This perfectly fits into our requirements for this project of needing it to have a focus on space, place, and location through its use of different mapping techniques.
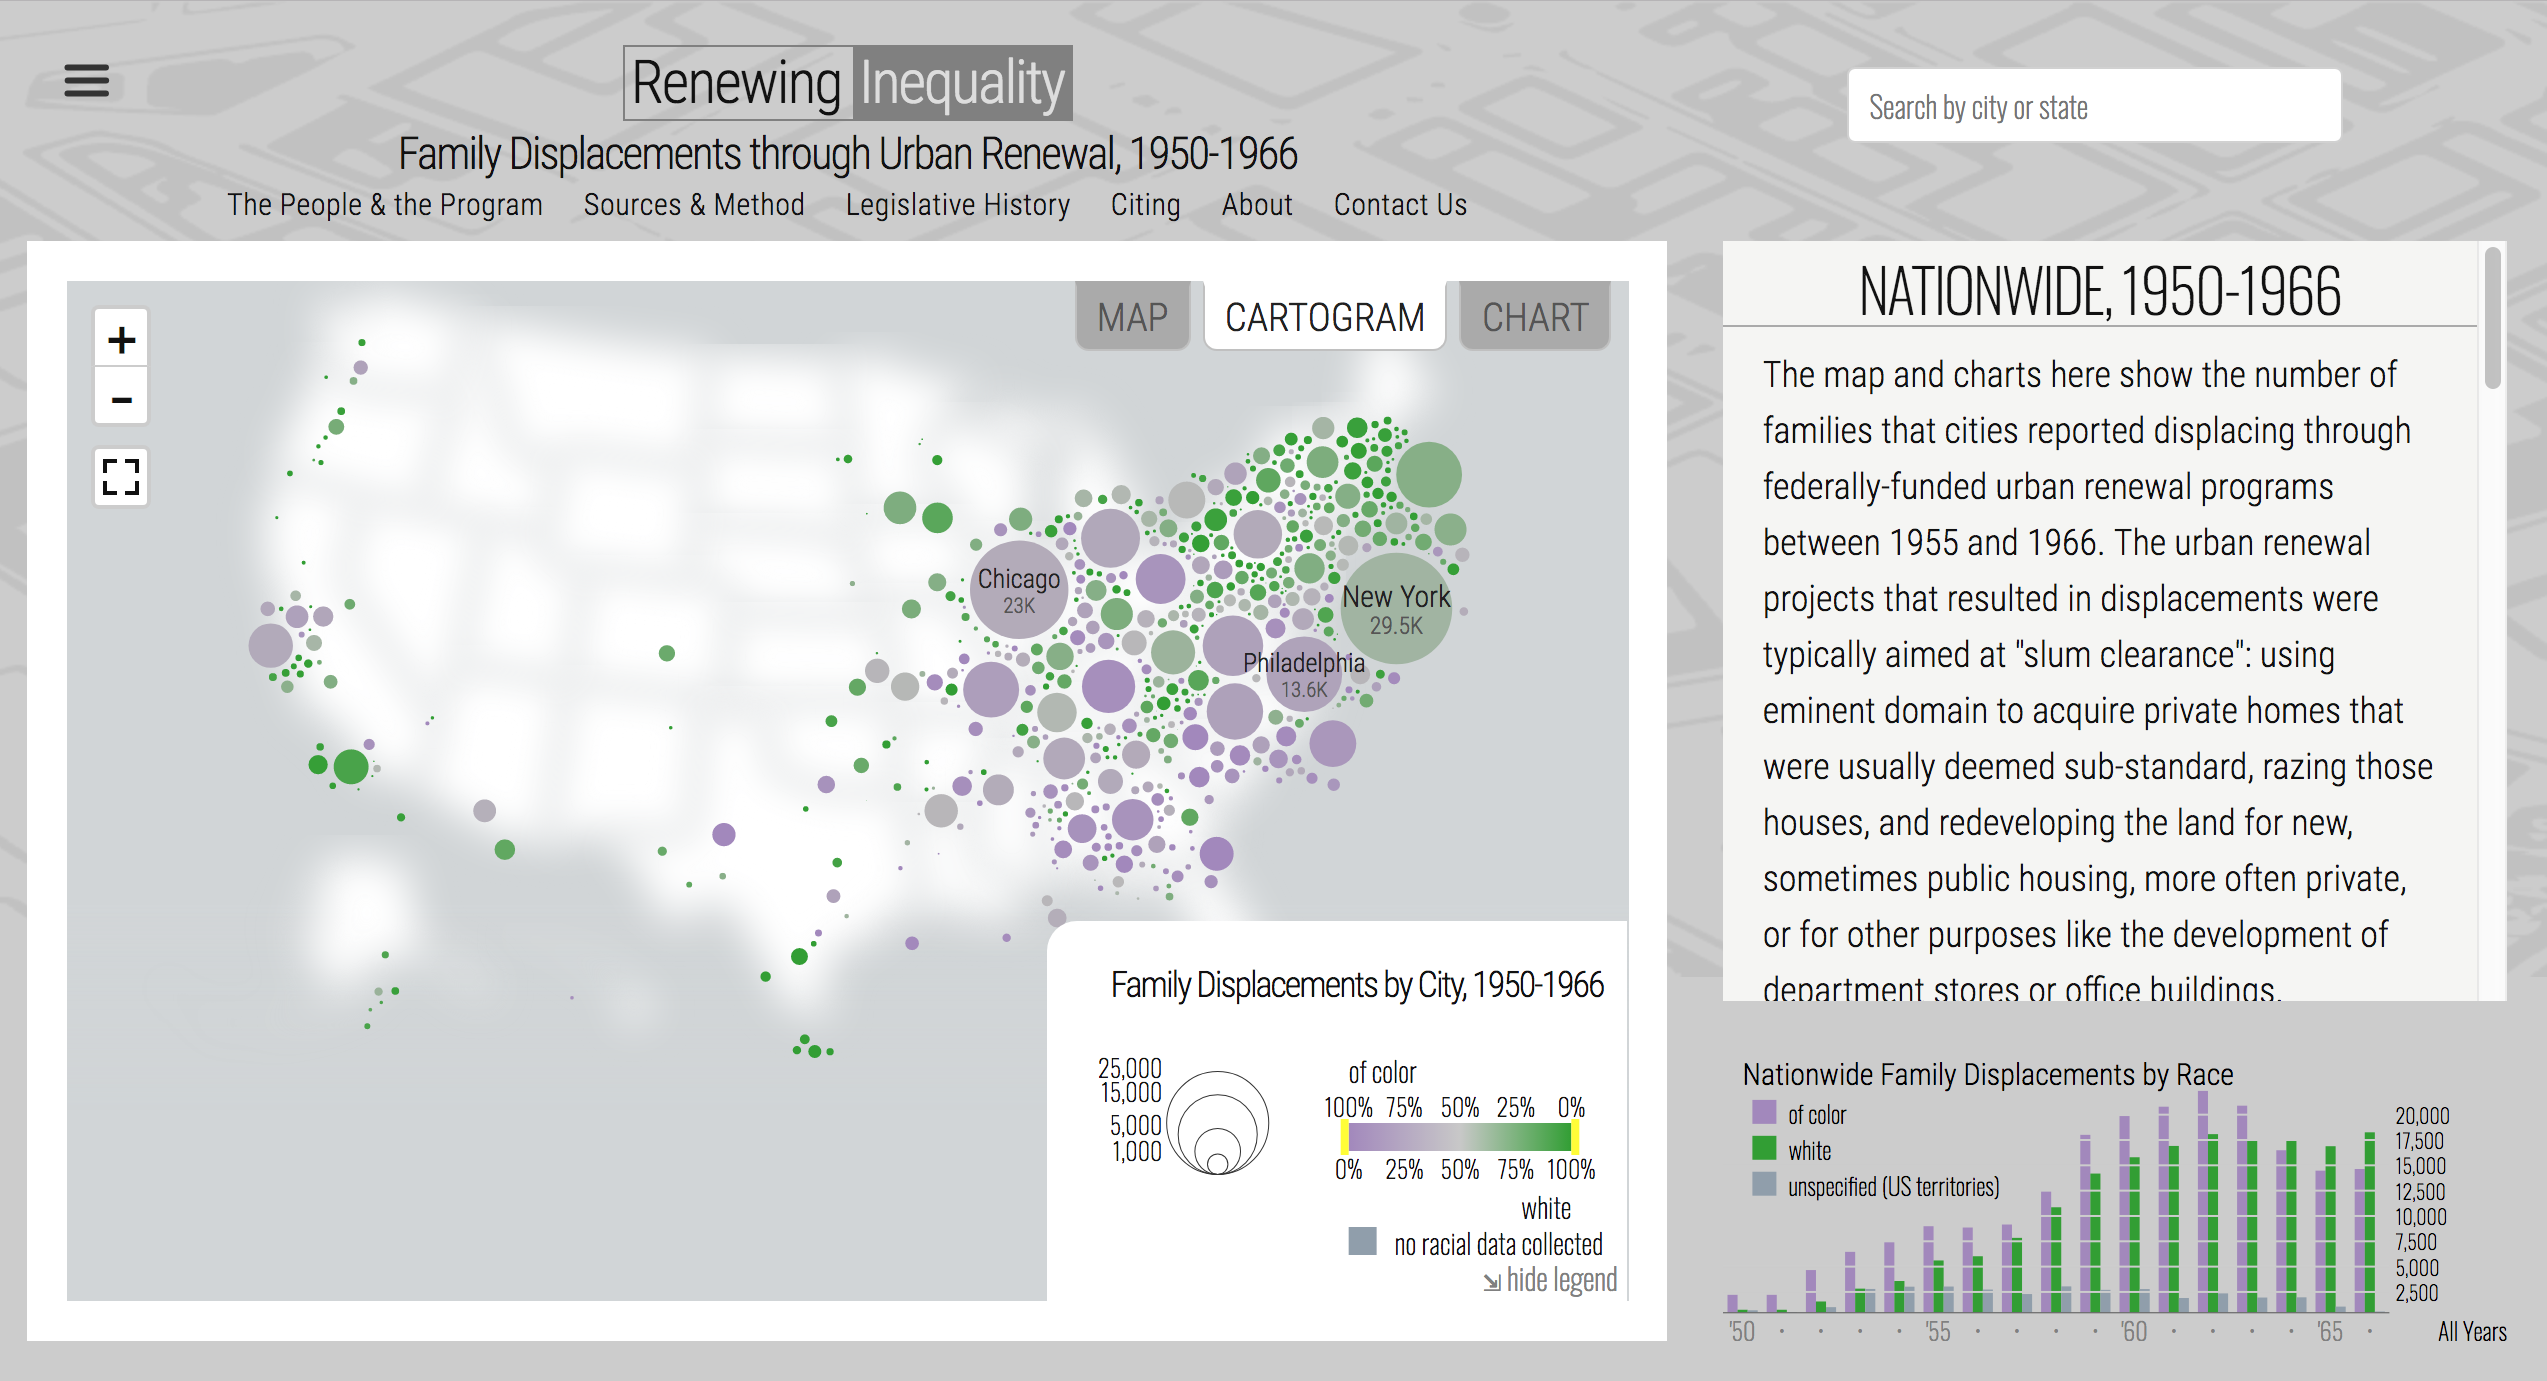
As shown above, this is the landing page for the project, it uses a bubble graph to show the number of displaced families in a given city or county. This project also highlights through the use of color what race the family was that was displaced. Green represents caucasian, while purple is those of color. As a user, you have the ability to change between the cartogram to the map or chart. While it does a great job of presenting the data, it also may contribute to sensory overload and can be complicated to navigate and understand the data. The creators of the project are aware of this and they kindly created a tutorial that is shown before you visit the project’s site.
One other criticism of this project is the short time span shown for the urban renewal. This is due to the government only providing data for 1955 through 1966 even though the projects were funded for another eight years. A continuation of this is that the data that was in the “Urban Renewal Project Characteristics” which is the data given by the government, is that this was only a part of all the displacements. This is because they are only estimates of displacement which most likely means there were many more displaced than previously thought. They only tracked the displacement of families and not individuals so that number was never tracked. That means that those displaced could go up by the thousands in some areas.
Pros of Renewing Inequality
What this project does well is just about everything else. Renewing Inequality is a very well organized, and thorough project that presents its data very well. The interactive map is confusing at times, but it holds an incredible amount of information that is really useful for the project. Not only that but they have pages set aside for the creators, methodology, the legislation around urban renewal, their sources and citations, and contact pages. They also have a plethora of visuals to help aid in all the information being presented in the project and they help drive the point home that urban renewal projects in the 1950’s-60’s were handled wrong and unjustly. As discussed in the methodology page, the source of information for this project came from the government, so this project information comes directly from those who were doing the displacement giving this project authenticity and credibility which is crucial for projects of this magnitude. As mentioned above, the information that was given, even though it was from the government, it was not 100% accurate.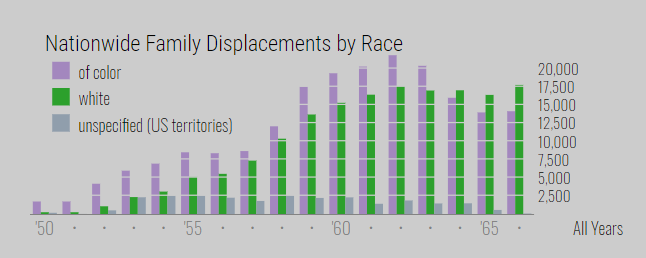
For the information that the team at the University of Richmond’s Digital Scholarship Lab did have, they created a phenomenal project. In relation to space, place, location, and the digital humanities they were able to complete their goal of showing the impact and scale of urban renewal projects from 1950-1966 across the U. S. while also attempting to show if there was a relationship between the displacement of families and the race of said families.