Mapping the Republic of Letters partnered with Cultures of Knowledge at the University of Oxford, Groupe D’Alembert, CNRS, Circulation of Knowledge and Learned Practices in the 17th-century Dutch Republic, and DensityDesign to conduct a host of research. This research was focused in specific case studies looking at the correspondence patterns of certain individuals or groups. The methods used in the case study and in the data visualizations featured within specific case studies are detailed below.
Case Study Methodology
Mapping the Republic of Letters consists of 12 case studies looking at the correspondence, travel, and/or publication patterns of historians, philosophers, and even political groups such as the Spanish Empire. It is noted that most of the case studies are “based on a different information source and so each one presents different problems of data handling as well as unique information visualization challenges.” Because each study presents different data, below are three highlighted case studies, ranging from dense to shallow research, that represent the collection effectively.
Data Visualization Methodology
Synopsized on the Overview & Significance page, multiple tools have been used within the Mapping the Republic of Letters project. Detailed below are examples of the primary tools utilized within the project.
Palladio
Many of the data visualizations exhibited in the Mapping the Republic of Letters project were produced with Palladio. Palladio is a digital mapping tool created by the Humanities+Design research lab at Stanford University. The tool is a product of the NEH Implementation grant (July 2013-June 2016), Networks in History: Data-driven tools for analyzing relationships across time. Palladio’s main function is to make visualizing historical data simple, making it in turn incredibly useful for the Mapping the Republic ofLetters project. Specifically designed for Mapping the Republic of Letters, Palladio was “oriented . . . around the development of a general-purpose suite of visualization and analytical tools.”
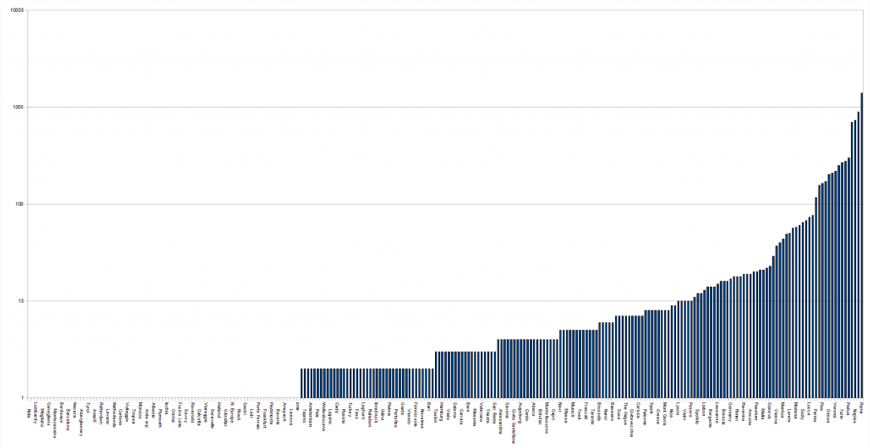
Mapping the Republic of Letters uses Palladio specifically to display an array of information on a case study. Some case studies do not have data visualizations and the ones that do vary in type. The data visualizations utilized include bar graphs, line graphs, and other metaphorical mapping methods that quantified the demographics of the letters of correspondence being examined. The data visualization that maps space, location, and time is pictured below.
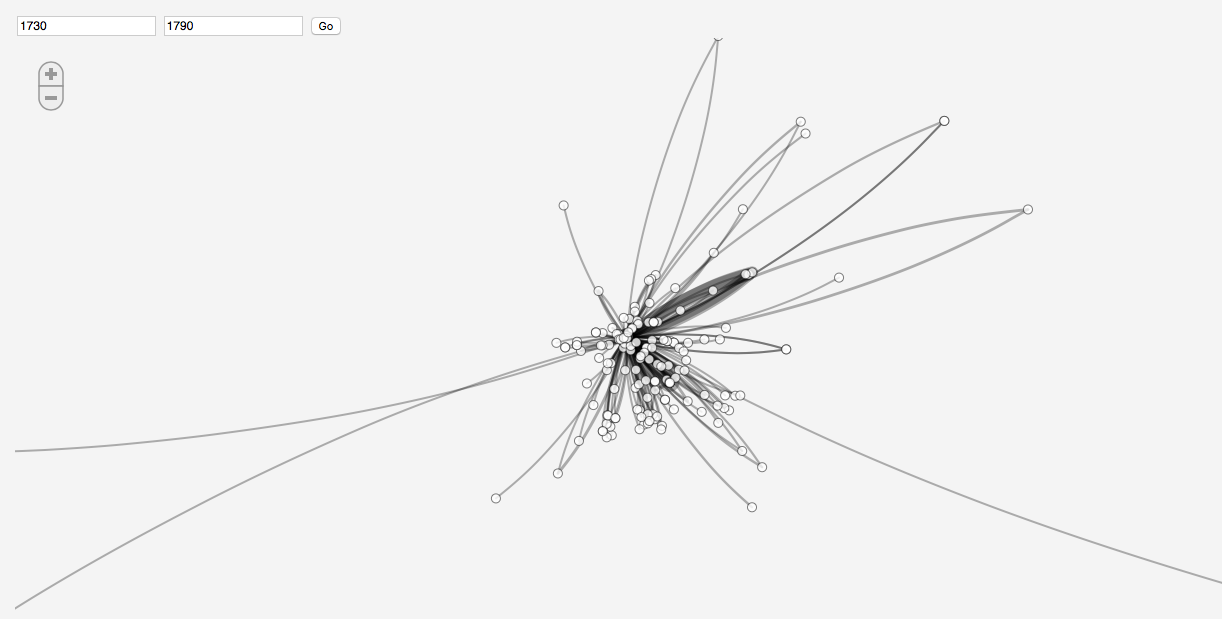
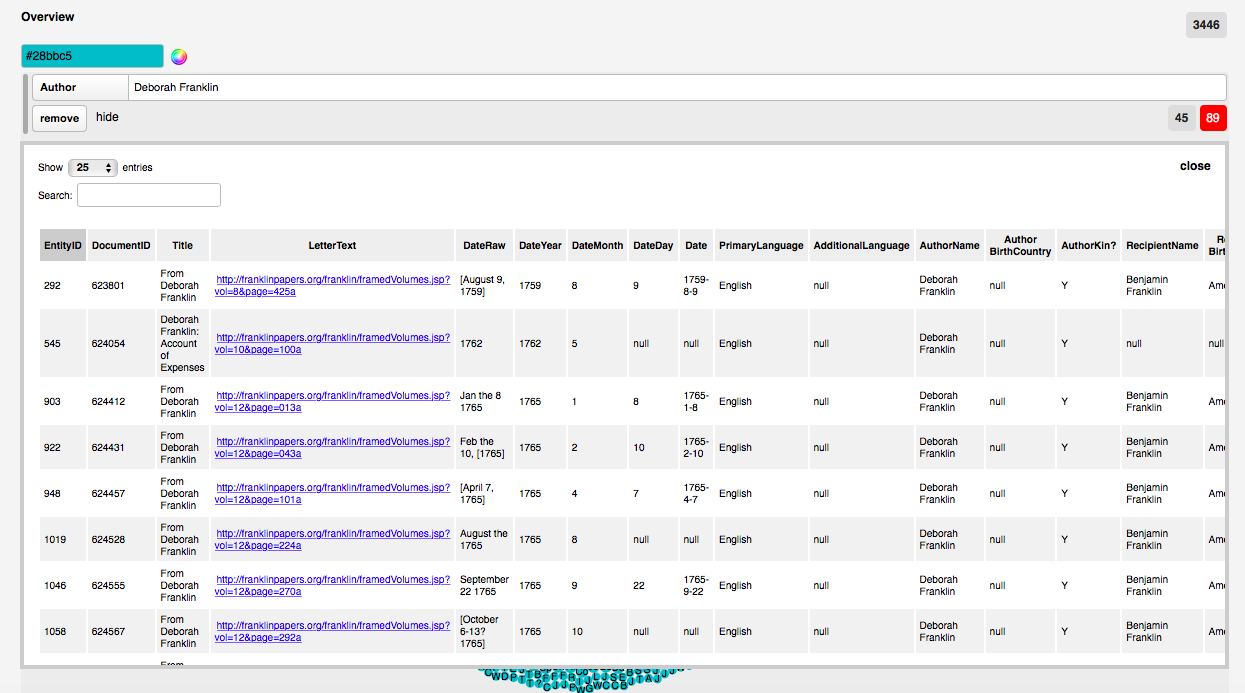
Each line in the map represents a connection between the source and destination of a letter, but does not indicate in which direction the letter is going. When users click on a line, they are taken to a spreadsheet display of the author, recipient, destination, source, etc.
Timechart
Timechart, utilized in the Grand Tour project, is “an experiment in viewing estimated duration cummulatively.” The tool was specifically created for Mapping the Republic of Letters. The project, however, does not provide links to the tool or explain how it functions.