
When opening the website (Gortana et al., 2017), after a short introduction the viewer is presented with all the available coins clustered together into one big pile. While this certainly follows Shneiderman’s (1996) practice of starting with an overview and giving detailed information on demand, it also serves an educational purpose. Starting out with a single big pile of coins shows that there is not just one inherent structure to them but a multitude of different ways to sort and slice the entire collection. In contrast to the physical world, where sorting coins is a tedious task, the powers of an interactive and dynamic display make it possible to try out any number of arrangements, transforming a pile into a sorted grid in the blink of an eye.
– Gortana, von Tenspolde, Guhlmann, & Dörk (2018)
The creators of COINS wanted a way to transfer the Münzkabinett’s extensive coin collection into a user-friendly website. They began the process by creating a workshop asking both numismatists and lay people to create collages showing what types of layouts they wanted to engage with when looking at coins. From here, they asked the question: How can we devise a new form of access that is playful, while still providing meaningful insights into the collection?
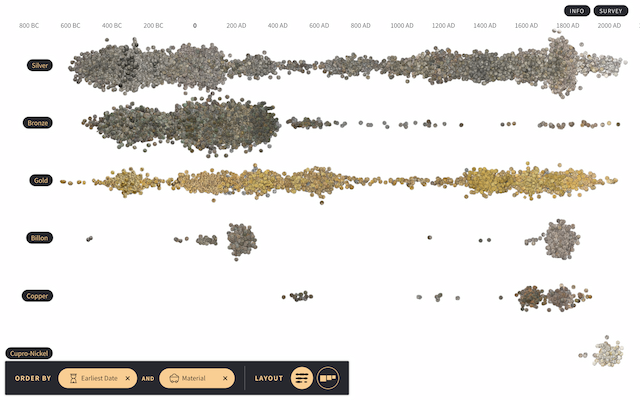
From here, the creators used paper and physical coins to map out potentially useful layouts based upon the feedback they received, taking inspiration from other museum websites. This is when they realized the best ways to format the coins were in piles, streams, clusters, and grids, each organized differently based upon whichever characteristic(s) was chosen (e.g. weight, diameter, country, date). The next step was to gather data of the physical coins and the digital records from catalogues. Continuing on, they collaborated with numismaticians who are familiar with the Münzkabinett’s coin collection and their ongoing digitization efforts. Using this data, they produced an output of the HTML page for visualization
Once they realized how they wanted to present the data, it was simply a manner of finding the right tools to do so. The team does not provide clear information on their methods when it comes to making sure all the tools work effectively together. In the report, they do not include how the team created the visualizations.
