
The Scottish Witchcraft Database consists of geographically locating and visualizing different locations of accused witches recorded by the Survey of Scottish Witchcraft Database in the 16th and 17th century.
The project is a unique idea on tracking accused witches with interactive visuals. It contains different categories such as places of residence of accused witches with a timeline where you can click on a witch on the map. It has information about the specific witch you click such as gender, occupation, class, etc. There’s also an option to only view certain witches on the map. It also links you to their Wikipage which has more information about the witch. This creates a very effective way for people to look through the data.
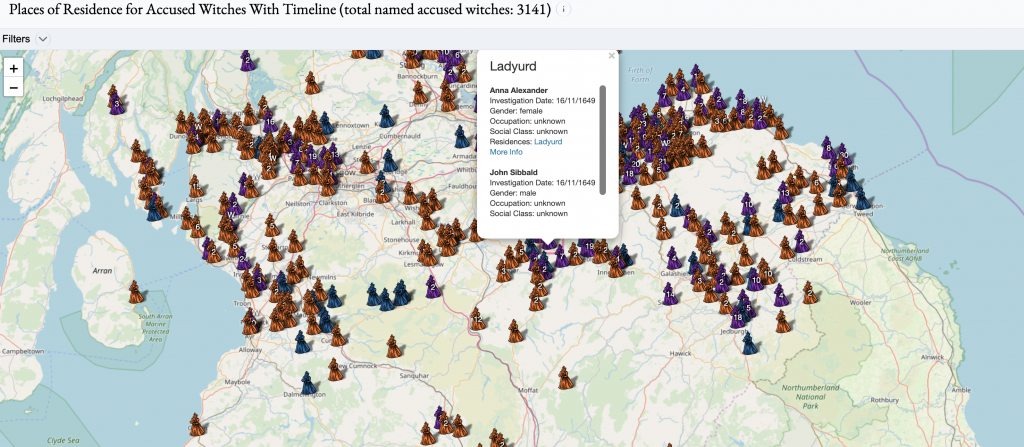
The project has a separate page when clicking on a witch in the timeline. It consists of a database known as Wikidata where people can search for specific witches through various categories such as accused witches by name and place, dates, and people involved. It displays more information about the witch. The various filters allows for more organization and creates an easier way to search for something specific.
This project was created by master students at the University of Edinburgh with no prior experience. Hence, there are flaws such as unnecessary visualizations or failing in conveying to a project audience. Not many specific people may need information on visualizations of accused witches. The main goal to the project is more towards a learning tool for the students who created the project rather than accuracy.
The project uses many different visualizations to display accused witches such as bubble charts, line charts, bar graphs, and many others to link residences to their place of death. This overuse of visualizations is unnecessary and leads to clattered data. The project should use a couple visualizations that are relevant and easy to view. Some of the visualizations don’t load or are difficult to read. There’s no option to zoom in on the graphs and the names/labels overlap each other.

Overall, the project is still a work in progress as it has its flaws to it. It can be improved with more accurate data and less clutter of visual data. The idea itself is what makes it unique and the organization using Wikidata helps make the project stand out.
