Peers
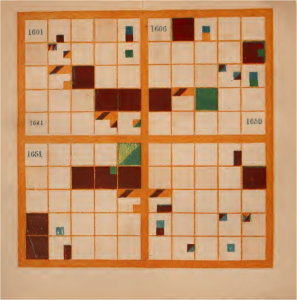
The Shape of History is not a unique project at all, it can be found in multiple projects that deal with history and data visualizations. For example most projects dealing with data visualizations display graph of some sort showing important data. In this article titled “Historical Visualizations” by David Staley explaining the different techniques that were used to display historical data. Most of the different techniques involved the data just being written, venn diagrams, graphs, or thought bubbles. The Shape of History project is much more interactive compared to the venn diagrams and etc. Not only is it more interactive it is more visual as well. On the overview page more information can be found regarding how The Shape of history project displays their historical data.
Context
Overall this project is complete, the goal was met for this project and nothing else has to be done further. Not only is the project complete it is mature as well.
