The main factors at work behind the project is the combination of a standard timeline and Peabody’s grid. The addition of shape and color to the timeline allows it to be a more visually engaging experience. Using position, color, and interactivity, the site allows for a truly unique tool that represents historical data.
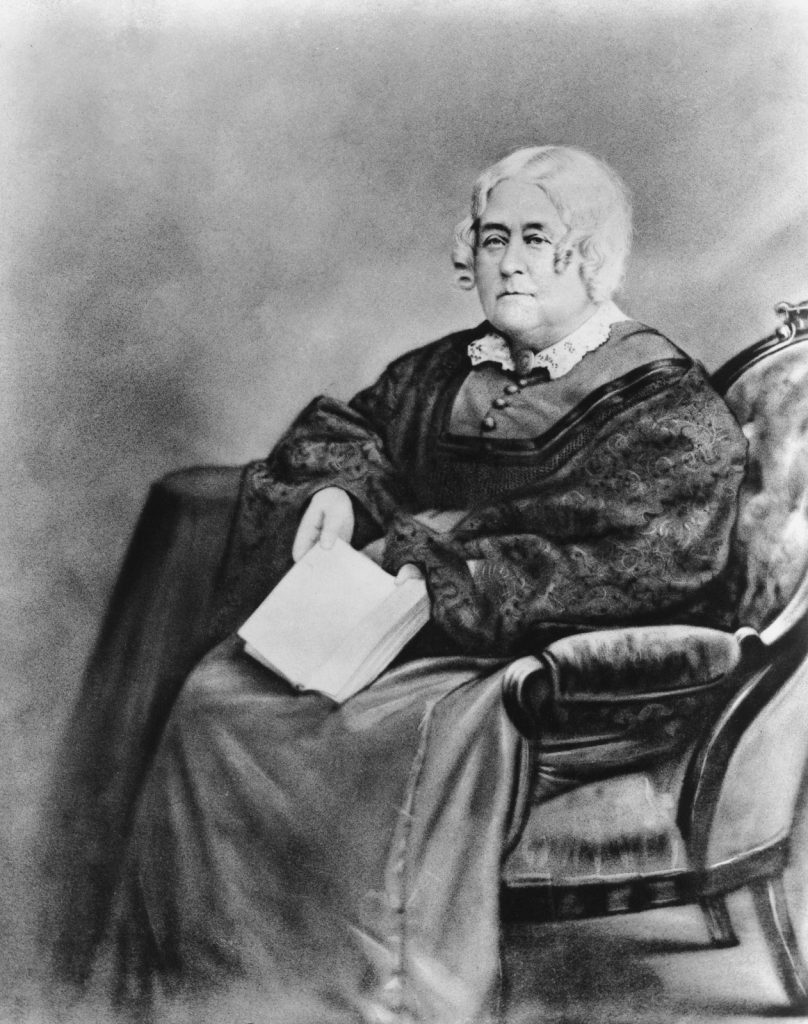
Peabody started her work before the American Civil War, in a time where access to education was limited. There were not a lot of people around to critique her work and improve it until over a century later when it was digitized by the Shape of History team. Initially, her students responded both positively and negatively to the challenge her grid-style graphic offered. It was a demanding process, consisting of cross-referencing multiple workbooks and contextualizing it in a way it could be visually presented.
Now, through the use of digitization, Peabody’s grid is much easier to create, show, and explain to people of any level of education. With more resources available, anyone can create their own grid without worrying about the societal barriers education provided in the past. The use of technology also allows for the unique visual experiences that Peabody aimed to provide. Though interactive links, viewers can even see the references the creator of the grid used to draw out the visual aspect.
