1980 Influenza Pandemic

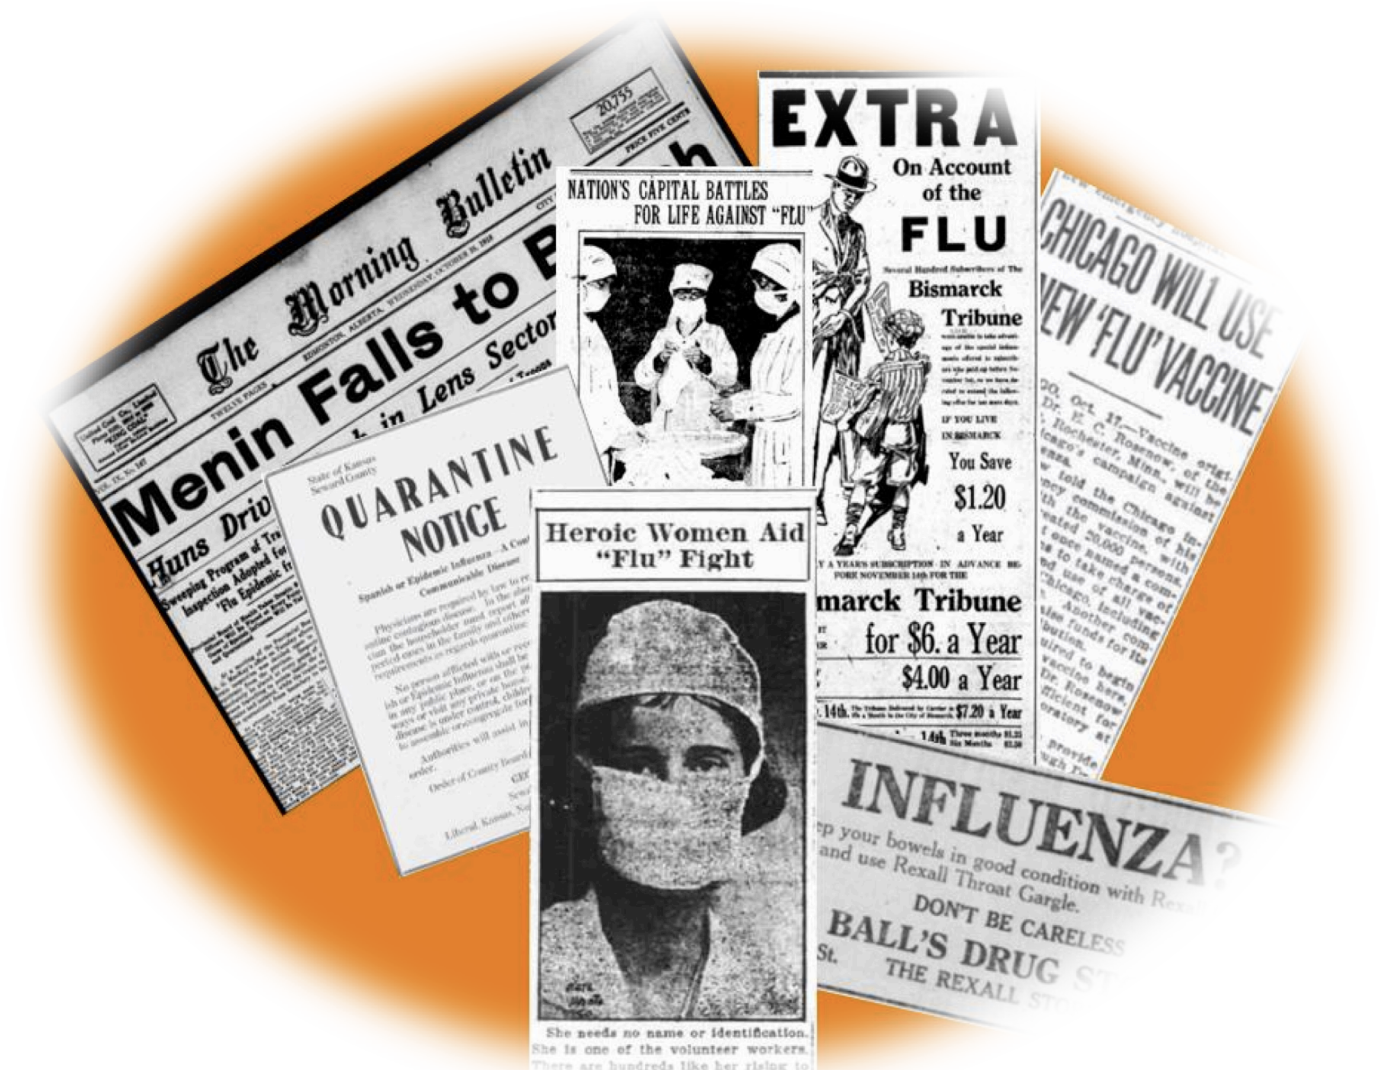
The project I chose is a digital humanities project created by Virginia Tech to explore the social, cultural, and medical impacts of the 1918 influenza pandemic across the United States and Canada. Exploring four case studies in which archival materials, interactive maps, and personal narratives tell the story of how communities experienced, understood, and responded to the effects of the pandemic. By combining historical research with digital tools, the project allows both scholars and the public to understand the flow of information during the pandemic.
Importance and Signifignance
Historically, the project provides a detailed view of how the 1918 influenza pandemic affected communities across the United States and Canada.
In DH, it showcases practices by using interactive maps, data visualization, and text analysis to make historical materials accessible and engaging.
The Four W’s
What
This is a digital archive and research resource curating primary source materials related to the influenza pandemic in Virginia to study the publication of the flu in newspapers, letters, photographs, public health records, and death statistics. Including interactive tools that also visualize the spread and effects of the pandemic.
Where
The project was created at Virginia Tech, materials and data represented in the archive focus on data reported in the United States and Canada.
When
The digital archive includes primary sources from the years 1918-1920, the project was created in 2012 and ended in 2014.
Who The project was created and maintained by Virginia Tech University Libraries through its Special Collections and University Archives and the Center for Digital Research and Scholarship. Conducted by professors, librarians and scholars. People | An Epidemiology of Information
Scope of Project
The project extends beyond collecting and preserving historical materials. The project seeks to interpret and visualize how the 1918 flu affected people differently across Virginia, connecting archival data to themes of race, geography, and social class. Users are able to explore the interactive features that reveal how the pandemic spread through various counties, impacted mortality rates, and influenced public health measures. The archive also supports teaching and research, making historical evidence accessible for educators, students, and all others interested.

Four Case Studies
Weekly Newspapers Case Study:
The case study provides examples of how weekly newspapers reported on influences across Virginia. Using automated text analysis, researchers discovered that weekly papers contained rich and nuanced information beyond mortality statistics. The study points to broader applications such as tracking disease information on social media in modern contexts.
Daily Newspapers Case Study:
Explores how scale influences automated analysis, when examining all papers, patterns in reporting differed significantly from those in individual newspapers. Some publications had inconsistent date quality, revealing that certain local stories gained national significance while others remained invisible in broader analyses.
Vaccination-Visualization Case Study:
Focuses on how data visualization shapes interpretation, using visualization tools, researchers traced specific words and topics.
Public Health Officials Case Study:
Examined public health discourse, specifically the role of Dr.Royal S. Copeland in shaping the response to the flu. By analyzing the proximity of key terms and phrases, topic modeling revealed how Copeland was associated with public health measures at both local and national levels.