Description & Link to Goals
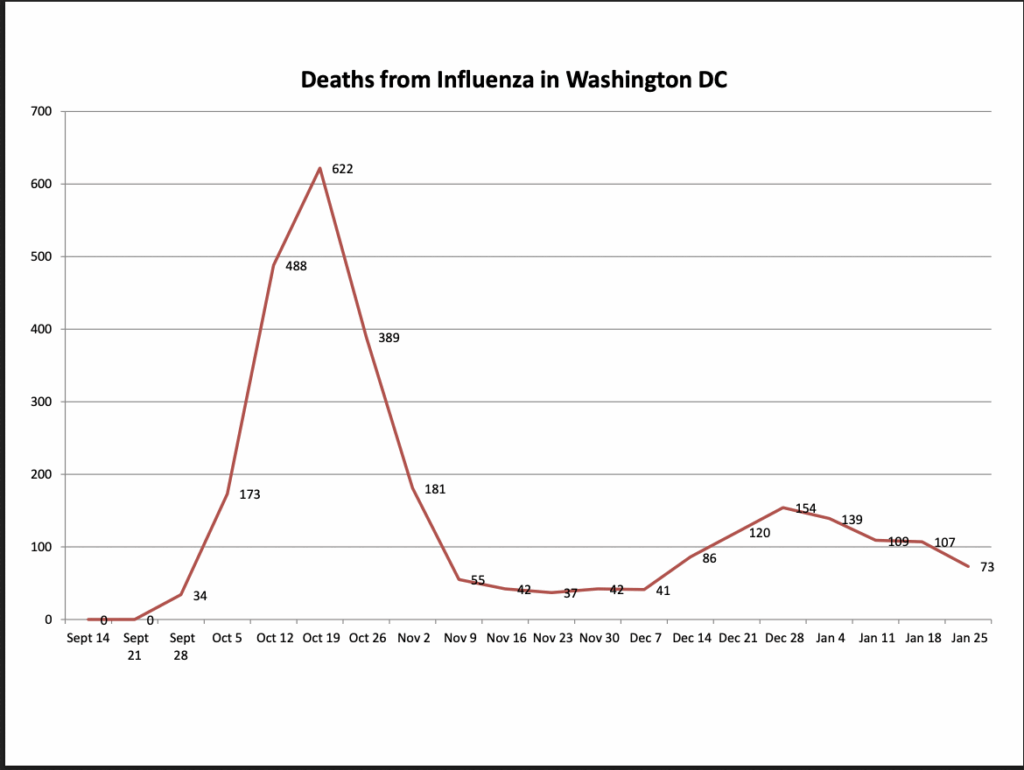
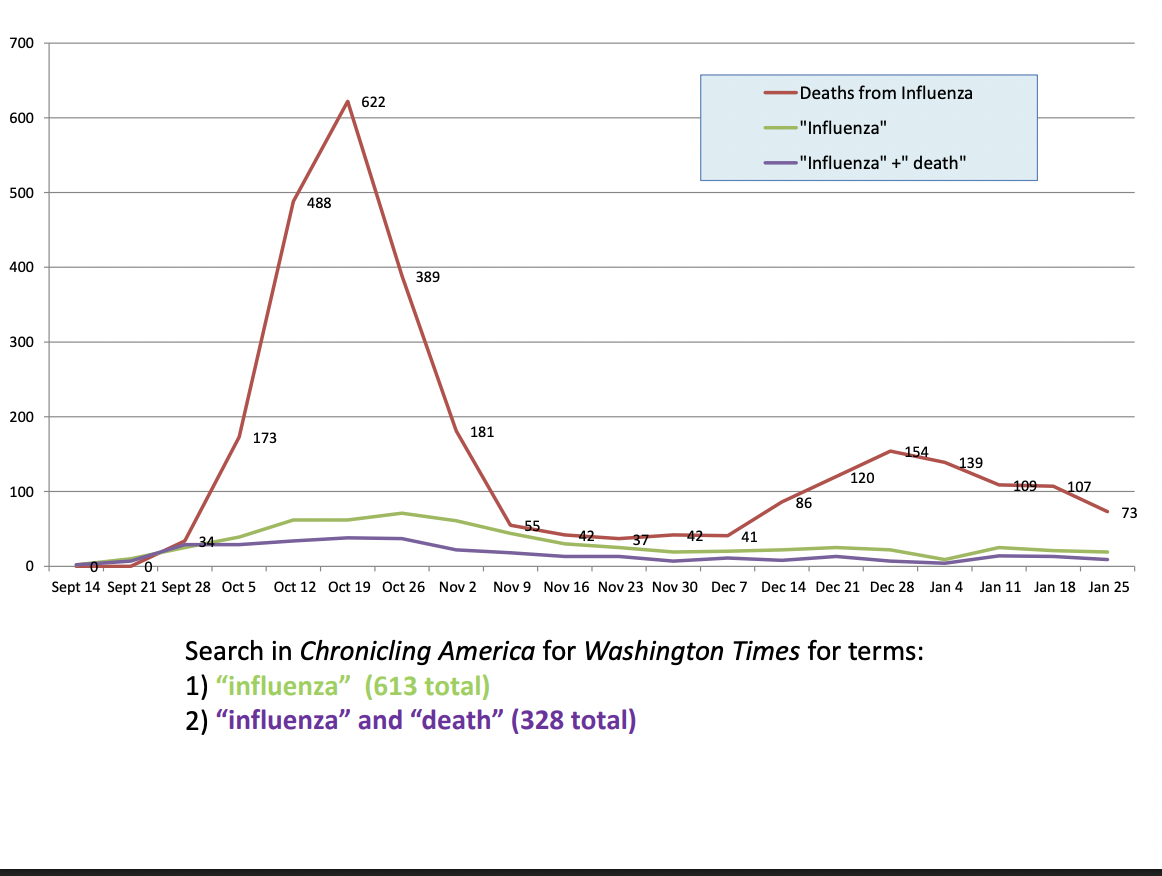
The project’s data supports its goals of preserving historical materials, analyzing pandemic patterns, and engaging the public. Including both quantitative data, which are the numbers of cases, deaths, and locations, and qualitative data texts, which are newspapers, letters, and reports, allowing for historical interpretation and digital analysis.
Type & Format
The project uses digitized text, images, metadata, and structured datasets. Textual data, such as newspapers and letters, stored in searchable formats suitable for text mining and topic modeling. Visual data such as maps, charts, and photographs, are presented in image formats, as interactive maps use visualization tools. These formats ensure compatibility, accessibility, and long-term digital preservation.
Input Data & Sources
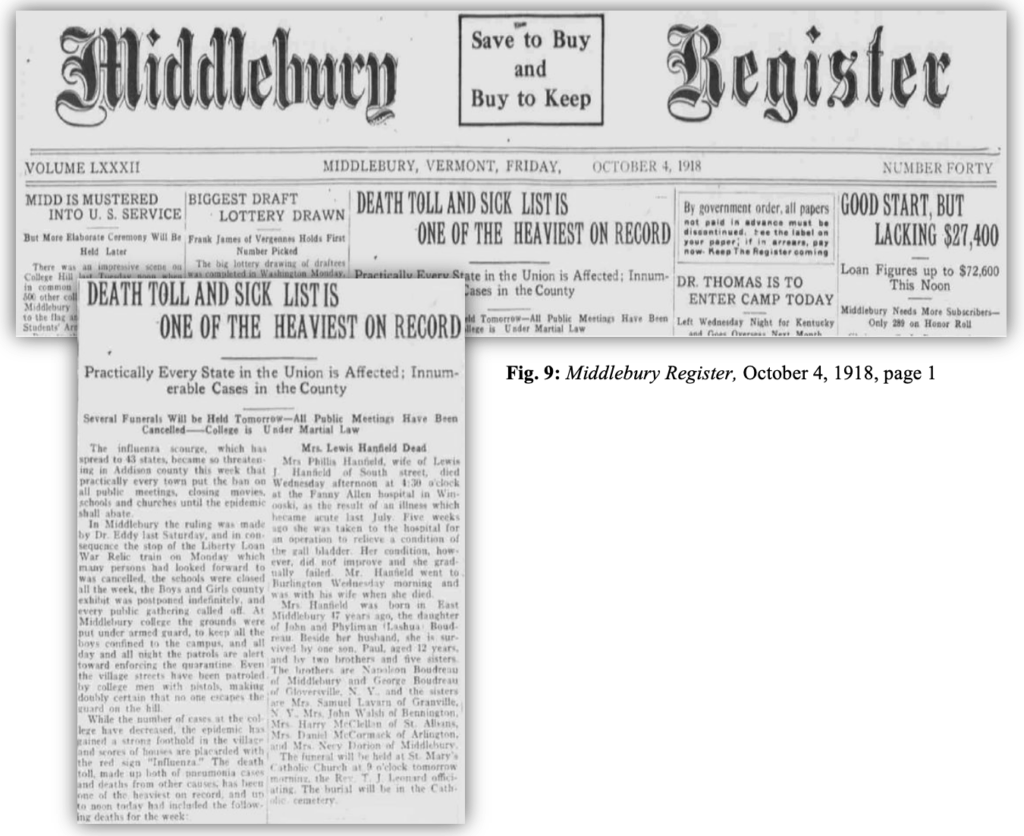
The project starts with archival materials from VT Special Collections and University Archives, and additional local and state archives.
- Digitized weekly and daily newspapers reporting influenza from 1918-1920
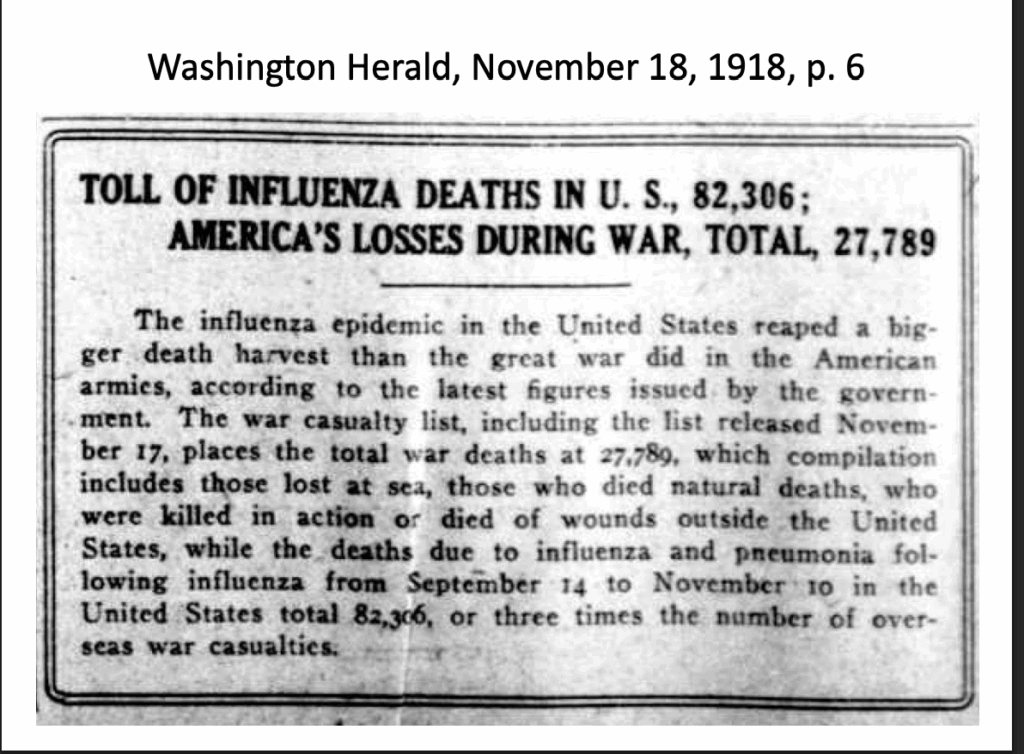
- Public health reports documenting infection rates and deaths
- Letters and diaries capturing personal and community experiences
- Government and medical records related to public health resp
Output Data & Sources
These outputs are presented through an open-access web platforms allowing users to explore the materials.
- Interactive maps and visualizations showing the spread and impact
- Text mining outputs that highlight patterns in newspaper reporting and public discourse
- Online exhibits and accessible digital archives
Data Sharing
The project’s data is publicly shared through Virginia Tech’s digital archive. Users access digitized materials, read case studies, and view data visualizations without restrictions.
Digital Humanities Best Practices: Documentation
It cites data sources, explains its cleaning and processing steps and publishes methodological reflections through its case studies. The project has a “Project Resource Report” and a “Resources” page.