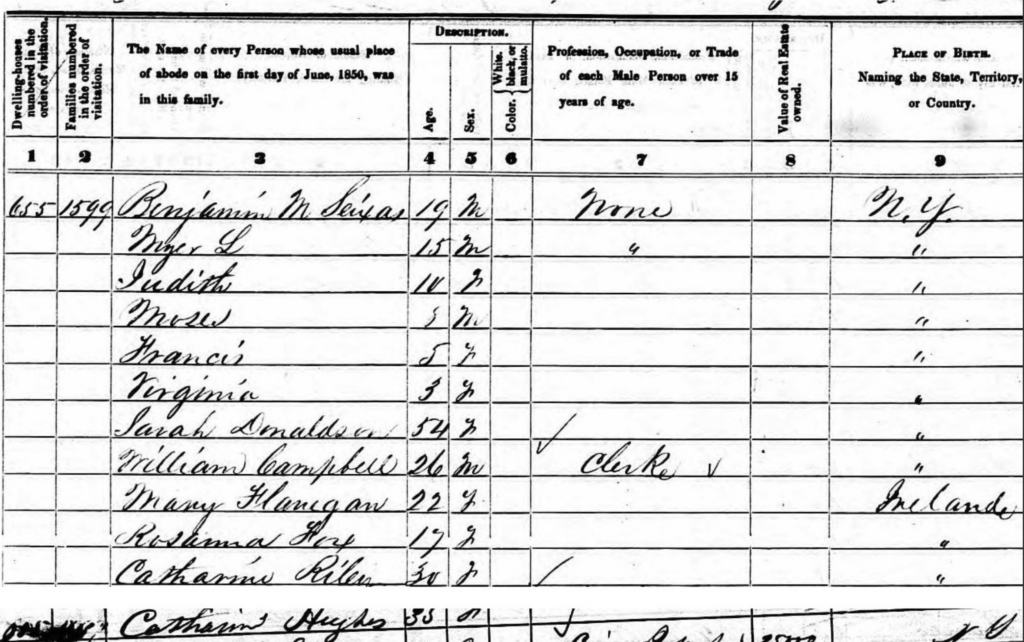
The picture above is the first cencus recorded from New York City and it only included the name if an individual, the profession/occupation, and finally that person place of birth, this is the base of the research and how the economist were able to display their results down bellow in the graphs. The authors of this website used information like this to show the changes in the Soho area year after year.
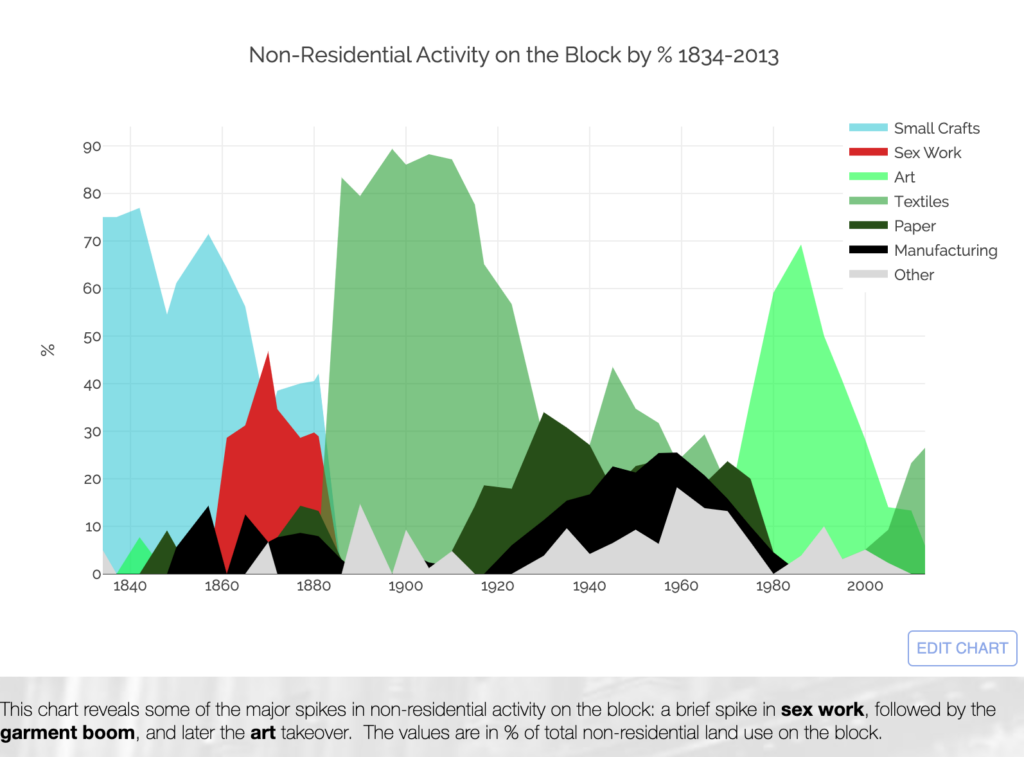
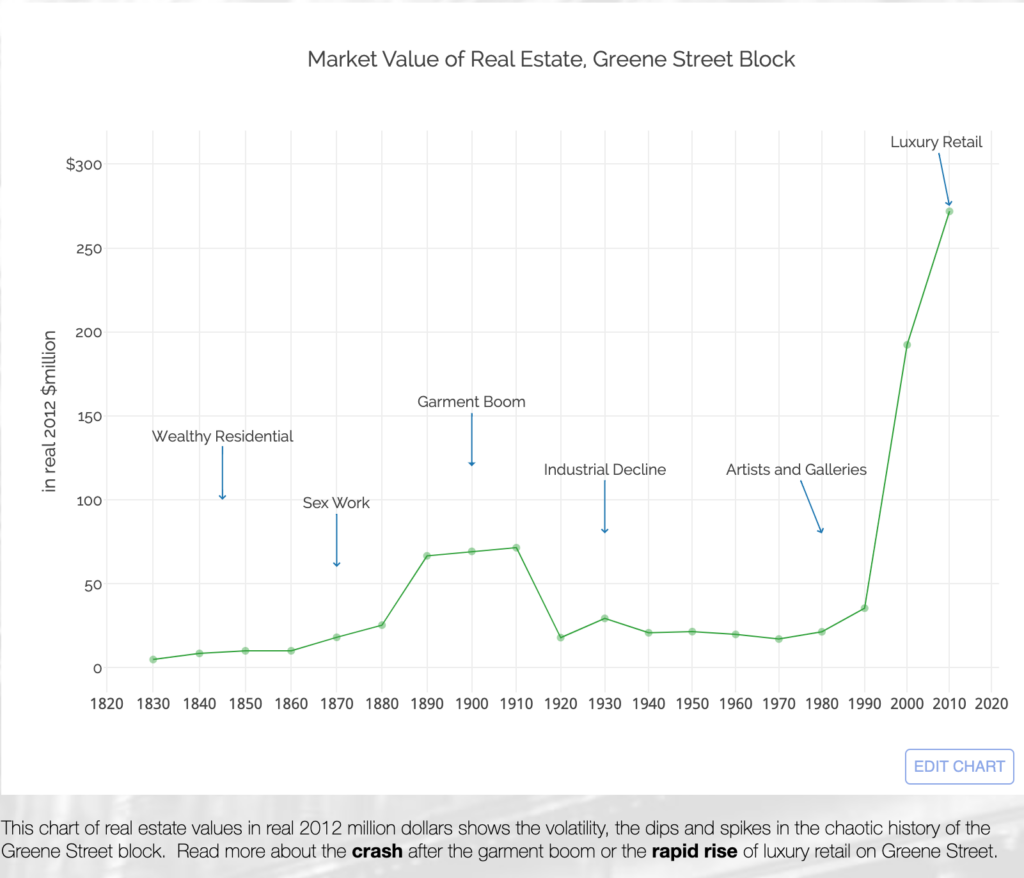
This is some of the collected data which represents Non-Residential activity(on the left) and how it has changed over the years, and on the right that graph shows the market value of realestae by the decade. This data was collected by analyzing the cencus records over the past 200 years.