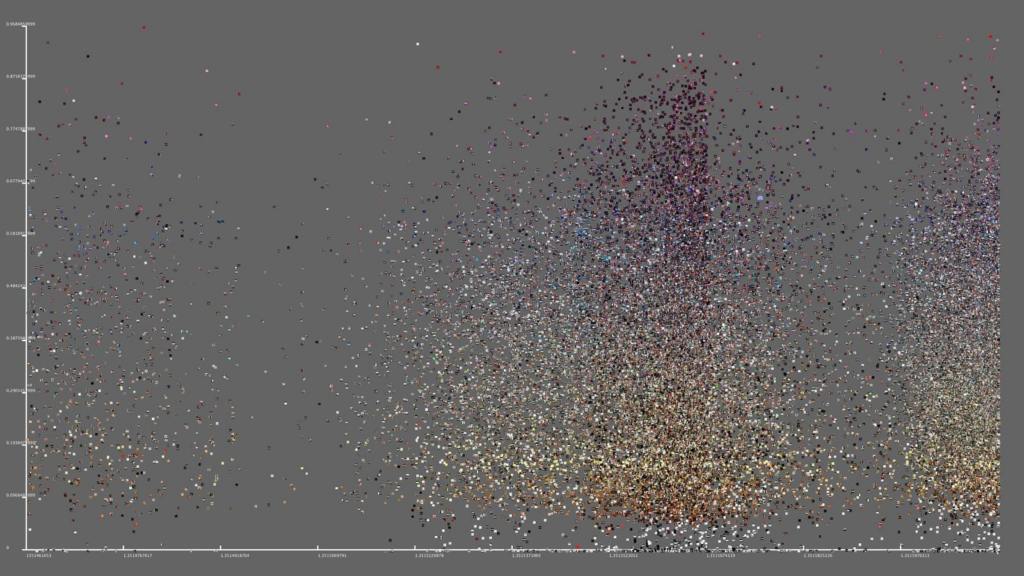
What is the Data
- Instagram photos + metadata
- Includes: Time, Location, Color/visual features
Type of Data Format
- Image data (photos)
- Metadata (numbers, timestamps, location data)
- Used because it allows quantitative and visual analysis
Input Data + Sources
- What does it start with?
- Millions of publicly shared Instagram images
- Where does it get it?
- Social media APIs (Instagram data collection tools)
Output Data + Formats
- Visualizations like: Radial graphs, Color maps, Image plots
- Shows patterns like: Time of day activity, Cultural differences
End Result
- Clear visual representations of how people behave in cities
Is the Data Shared?
- Yes (through research, visuals, and publications)
Connection to DH Best Practices (Documentation)
- Clearly documents: Methods, Data sources, Visuall outputs
- Makes data understandable → key DH goal
Assessment
- Clearly explains what the data is and where it comes from
- Strong transparency about data sources (APIs)
- Meets DH best practices by making the data understandable and accessible