The Phototrails project has analyzed a significant amount of user-generated photo data. Their first paper analyzed 2.3 million Instagram photos shared by people in 13 cities. A newer project from their lab analyzed 7,442,454 public Instagram images shared in Manhattan over five months. The research of there first paper titled “Zooming into an Instagram City: Reading the local through social media“, was focused on understanding the local context through social media. Therefore, the data they found likely connects these visual patterns, dynamics, structures, and insights related to local cultural patterns in user photographs.
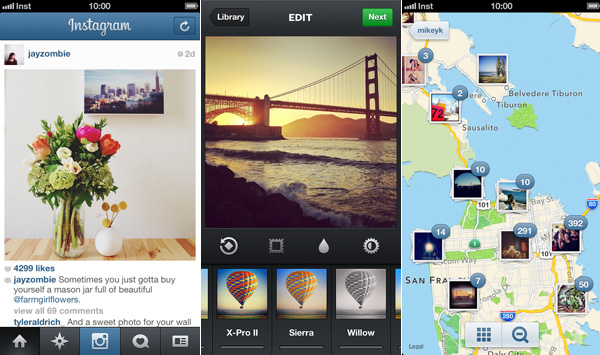
Using Instagram’s official API and the latitude and longitude data it provides, we crawled Instagram photos, and their metadata (user ID, location, comments, number of ‘likes’, date and timestamp, type of filter applied, and user–assigned tags) from 13 cities around the world.

The table shows information about the Instagram data set collected. Columns (left to right): cities, number of collected photos, number of users, collection dates, number of users who shared more than 30 photos.
The core data is millions of publicly shared photos. This directly aligns with the project’s goal of exploring visual patterns, techniques, and structures in photos and finding patterns around the world by analyzing this visual information. For example, their research analyzed 2.3 million Instagram photos shared by people in 13 global cities to find cultural patterns across different locations. Furthermore, their new project analyzes an even larger dataset of 7,442,454 public Instagram images shared in Manhattan, again aiming to gain insights from analyzing this massive visual universe