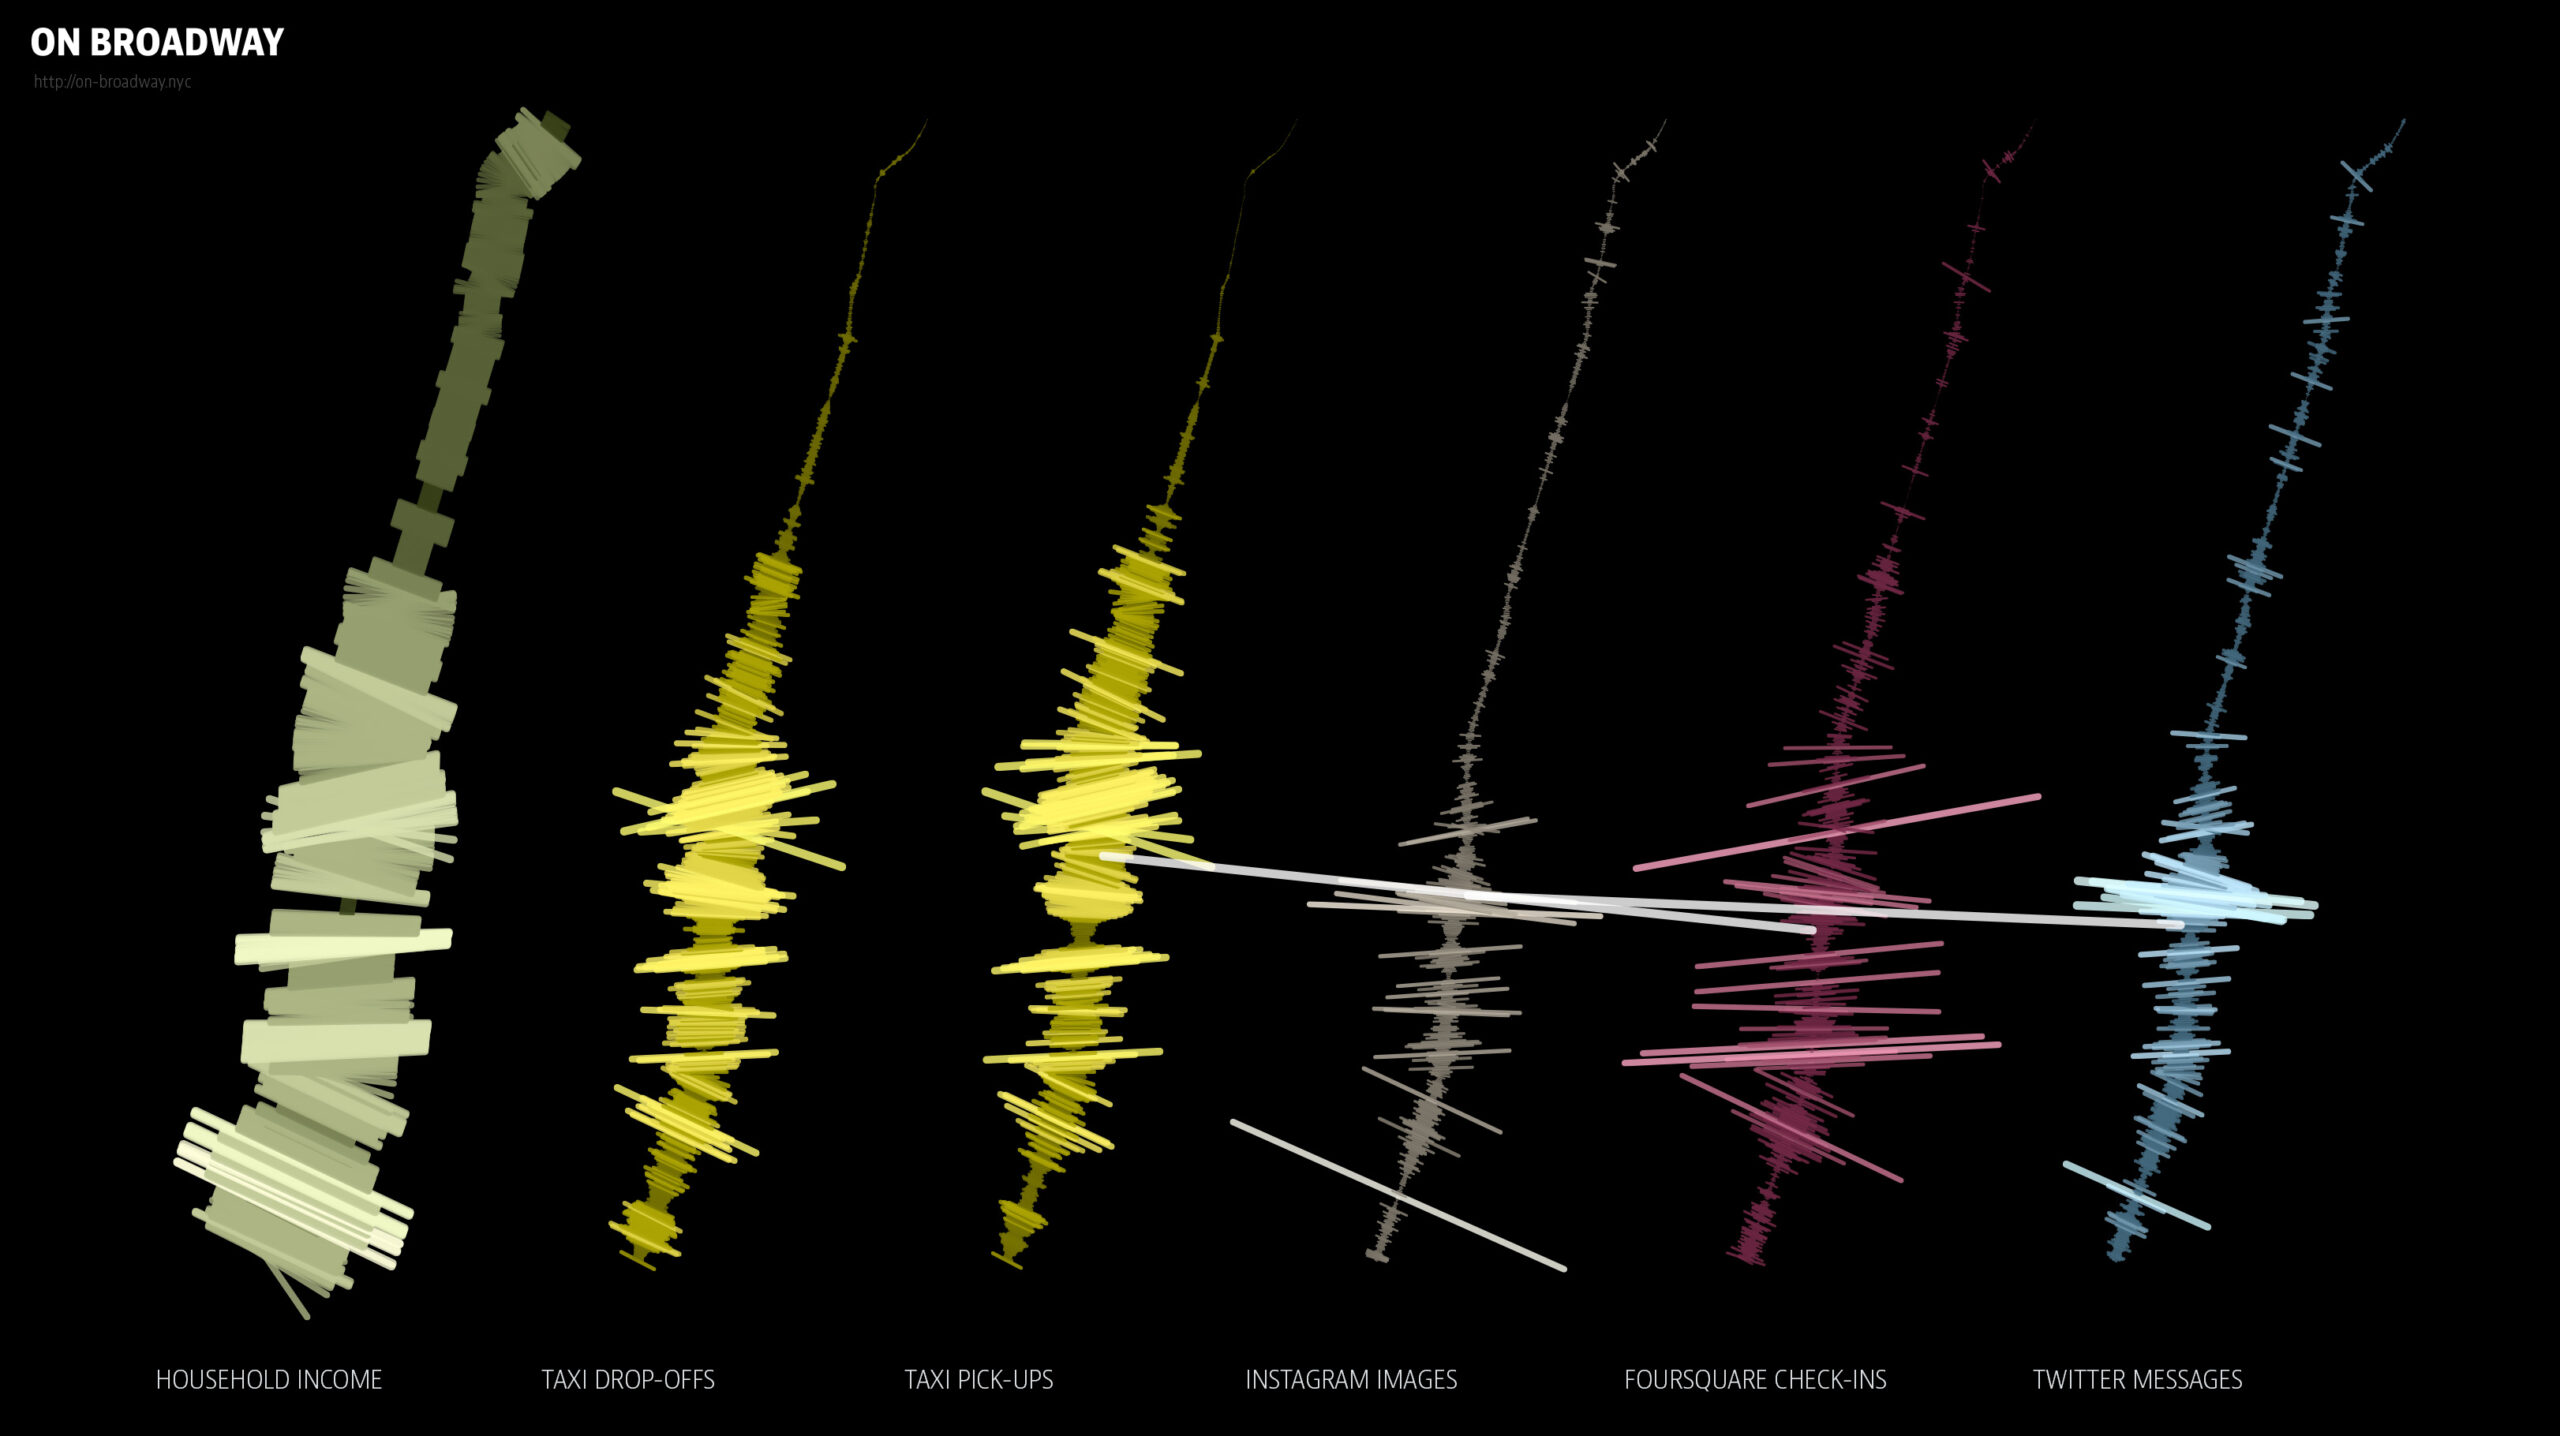
As a data visualization, On Broadway is a project that both uses and interprets data to reveal patterns of urban life. This data includes demographic information and developmental insights about New York City. This project draws from diverse data sources, including:
- Income levels
- Taxi usage
- Social media activity (Instagram and Twitter)
- Location check-ins (Foursquare)
Once the data was gathered, it was transformed into interactive visualizations which created an engaging map and timeline of urban activity. The visualization displays lighter and darker shades to indicate the density of activity. The darker and lighter areas reflect different volumes of photos, tweets, and check-ins. The width of the data lines also shows the volume of engagement at specific locations. This data is presented as a physical installation at an art museum.

The end result is a visually appealing project that incorporates the data that was gathered.
The project aligns with Digital Humanities principles by maintaining clear documentation and transparency in its data sources and methods. Each source, from social media platforms like Instagram and Twitter to public records and location data, is documented to ensure the project’s data is clear and replicable. This approach not only upholds DH standards of openness but also ensures that the visualization is accessible and understandable for a large audience.