Summary overview of project
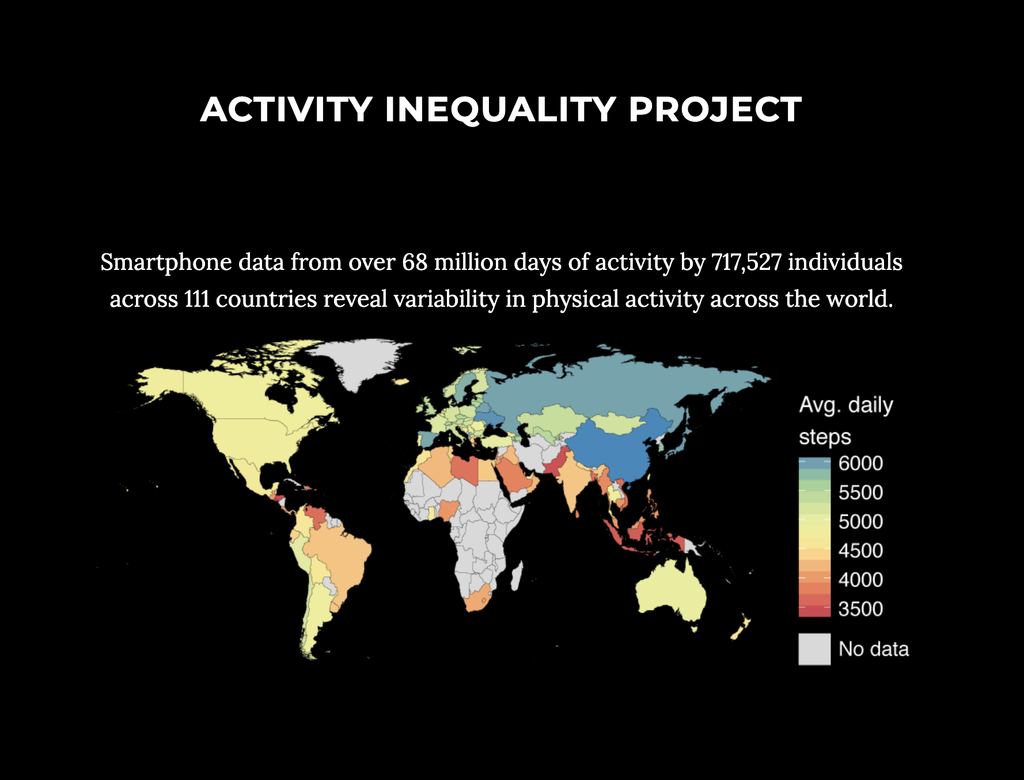
Activity inequality is a website where the researchers analyzed data from over 68 million days of activity by 717,527 individuals across 111 countries. This data was obtained through each smartphone’s built in accelerometers and a physical fitness tracking app. They were able to collect real time accurate data to draw conclusions about the gender inequality in movement, the walkability score of popular cities, predictions about obesity, and includes data about all different countries. They published a research paper where they provide the analyses of their data and the methods used to obtain it which gives us a deeper insight into the concept of activity inequality. Additionally, they also incorporated supplementary information documents which contain additional data about each countries, the obesity rate, and how their activity is affected.
Project Details:
Who?

Where?

A study conducted by Stanford University of how physical activity is distributed within populations around the world. The researchers used smartphone accelerometer data covering 68 million days of activity from 717,527 people in 111 countries. It examines factors that contribute to gender inequality in movement, and why some geographical areas are more active than others, and shows we can encourage more movement amongst everyone. This project was published in Nature (vol. 547, issue 7663) in July 2017. Stanford’s press release is dated July 10, 2017.
Detailed description of scope of project
- The scope of the project includes
- Data obtained from: iphone users and from only those who use the Azumio Argus app
- Time period: July 2013 to December 2014
- Demographics: gender, age, weight, height, health concerns.
Scope of the data set:
The data is only obtained from those who are iphone users and more particularly who are users of Azumio app. So our data is an examination of middle class income individuals who are somewhat comfortable with using technology because they have to use the app. We left out android users which may contribute to a large part of the data set and if we include them the data set may vary slightly. Next, taking into account the time period, this study was conducted from July 2013 to December 2014. It was a little over a year, but we have to take into consideration the weather conditions during those years which may have heavily impacted their physical movement abilities. Additionally, the app automatically records the individual’s demographics which contributes to the amount of movement. The project considers the gender aspect and concludes that females are less active than males especially in cities with lower walkability scores.
Scope of the research:
The project measures inequality by using the gini coefficient to statistically understand the gap between most and least active people in each country. Additionally, the website compares health outcomes related to physical activity by concluding that higher inequality rate usually correlates to higher obesity rates. The website states the correlation but does not establish that higher inequality causes obesity. The website also includes predictions about change in activity level and obesity. The website considers the walkability of cities and mentions that the amenities of a city can also affect one’s activity. They also take into account factors like gender expectations, safety concerns in cities especially for women which all affect the inequality score.
Out of Scope:
- Non iphone users
- Non Azumo app users
- Activities that may not be captured by phone such as heavy movement up and downstairs inside the house, cycling, swimming, and all the times that our phones are not carried with us.
- The paper suggests that policymakers implement some action to improve activity across the globe but doesn’t offer any specific policies or guidelines.
Establish importance/significance of project to area of study and DH:
The project is important because it assesses physical movement on a global scale and shows how the environment arounds us can change to improve movement. It explains the reasons for inequality such as the walkability scores, safety concerns, and how that affects our health with conditions like obesity. By analyzing this data, people are motivated to improve our physical health, and health researchers, urban planners, and governments can use the data to implement better policies. The project shares their data so it promote DH values of interdisciplinary collaborations, where people from different backgrounds can come, analyze the data, and improve overall conditions. The publicly accessible data also promotes transparency and openness, while accomplishing the DH goals of analyzing and interpreting cultural data.