What is the Data?
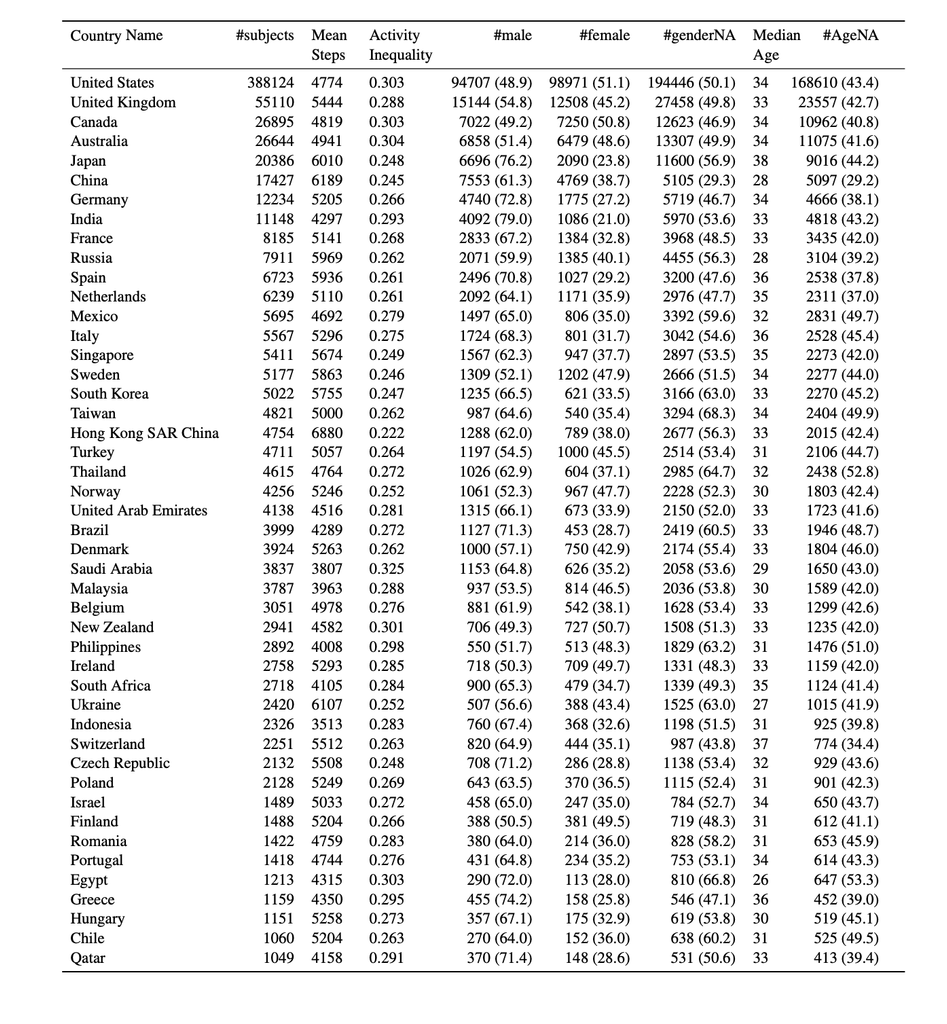
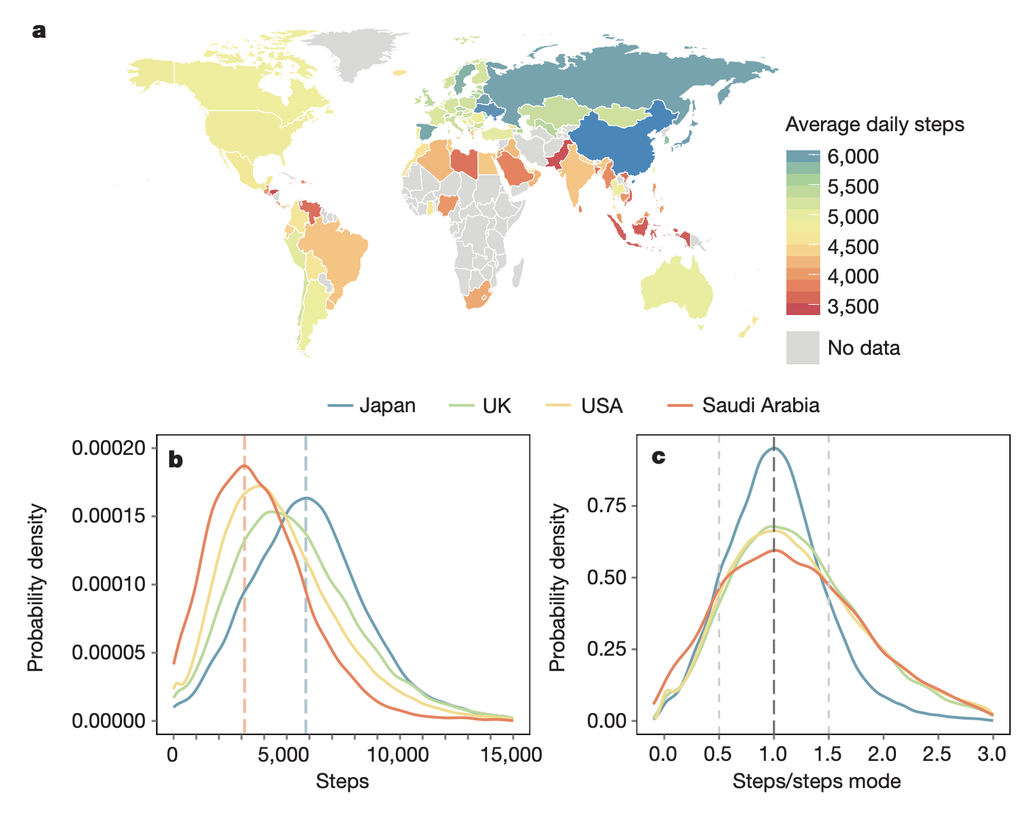
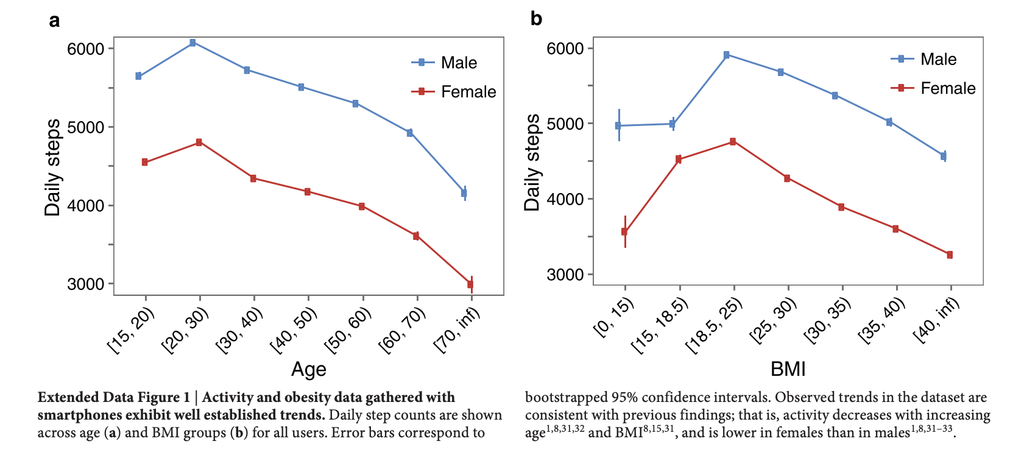
The data shows the average number of steps and collects the demographics of the users such as height, weight, and location. The data is organized through tables and graphs to show different correlations such as physical activity and gender, physical activity and walkability score of a city, physical activity and weight, and much more.
The data shows the average number of steps and collects the demographics of the users such as height, weight, and location. The data is organized through tables and graphs to show different correlations such as physical activity and gender, physical activity and walkability score of a city, physical activity and weight, and much more.
Input Data and Sources
1. The data is from the Argus IOS app fitness tracker app, over 68 million days of activity by 717,527 individuals across 111 countries.
2. Only data for those with atleast 10 days of activity was used.
3.Collected from July 2013 to December 2014
4. Demographics and location was also recorded
Output Data and Sources
By the end of the study, additional data such as walkability scores for cities, WHO estimates to check accuracy of data and population figures were also added to the data set. The data is shared through a github link.
Link to DH:
This experiment follows DH practices of documentation and openness. The project clearly documents each one of their methods used, the scope of the project, the limitations, the tools, and all the data. The website also includes a supplementary information article which incorporates additional data to deeply understand and analyze the project. Additionally, the project also follows DH principle of openness. By making their data and code publicly available and authorizing it to use for independent research, they are promoting collaboration and focused on the benefit of society.