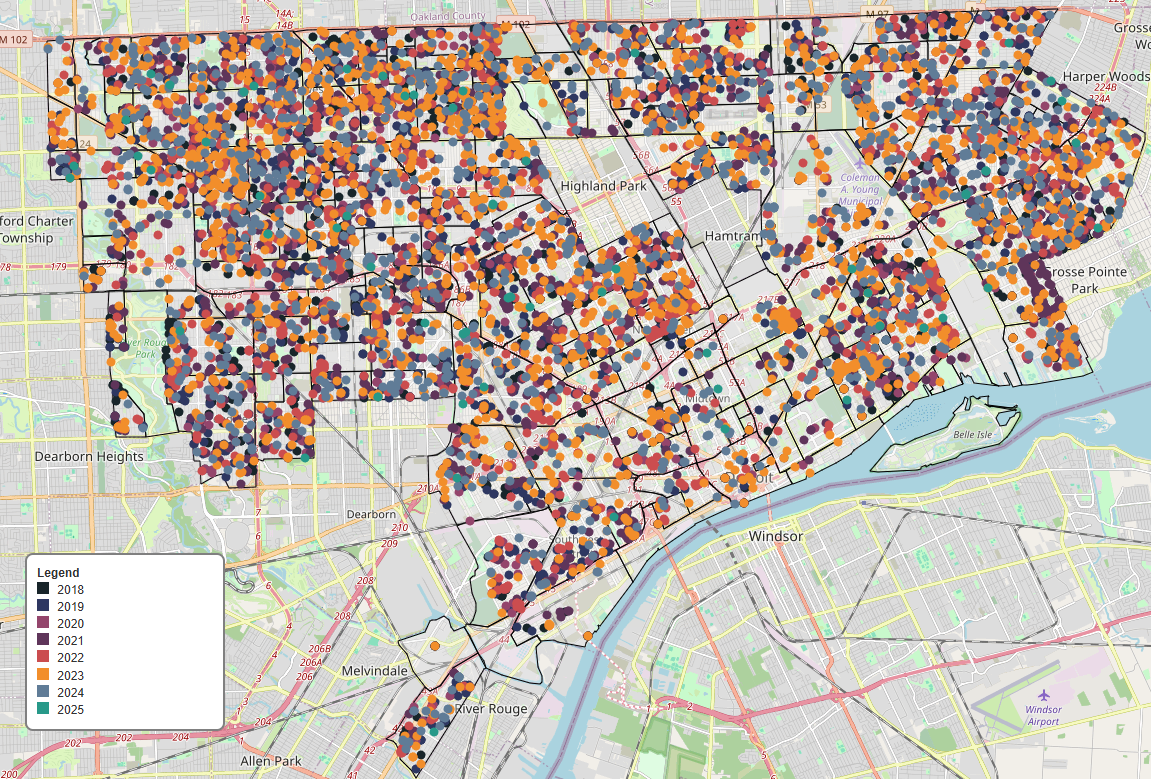
Overview:
Detroitography starts by collecting raw neighborhood and demographic data from public sources like Census tables, city records, and GIS datasets. The data is cleaned, organized, and formatted to be compatible with mapping tools. Once the data is ready, it is integrated into the website, where it is transformed into interactive maps and visualizations that users can explore online.
Critical Step:
The most important step is building the interactive maps on the website. Using Gatsby, the developers combine the structured data with mapping libraries like Leaflet or Mapbox. This step turns raw numbers and coordinates into visual, user-friendly maps, allowing viewers to see spatial patterns and neighborhood differences across Detroit.