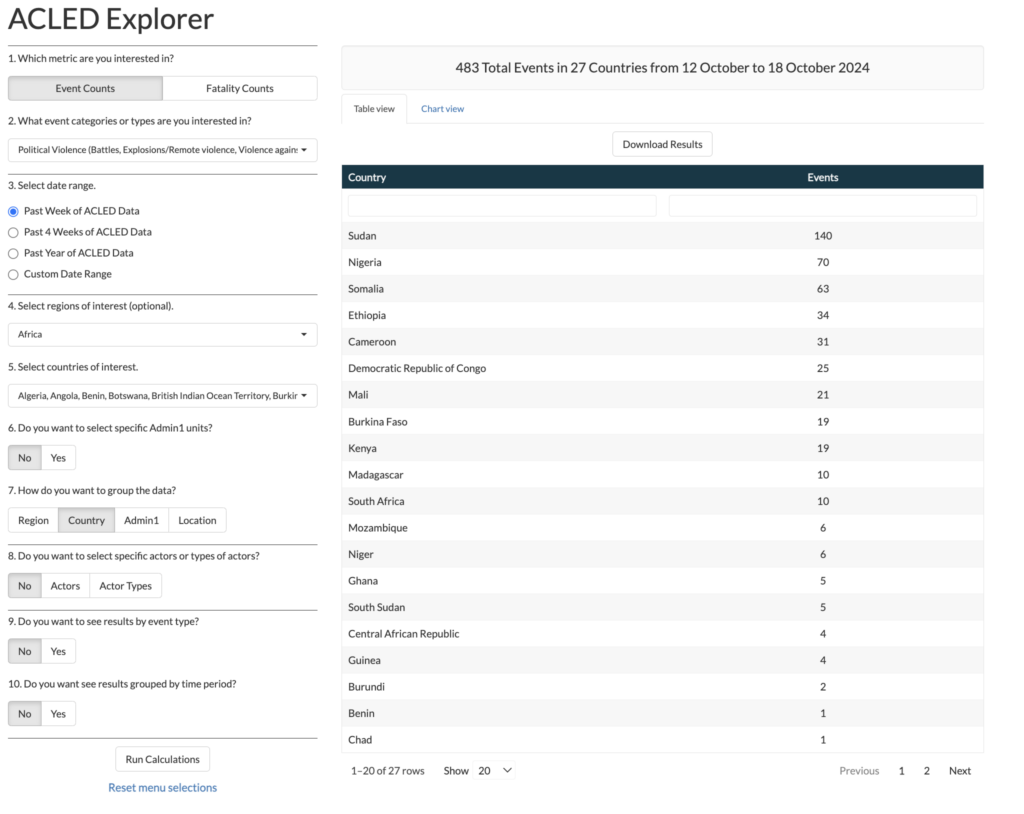
The ACLED Explorer allows for the sorting of data geographically, temporally and through the types of conflicts. This data can be displayed numerically and through pie graphs that allows for the comparison of violent events between countries and regions. This tool shows us where the most violence occurs, what type of violence is taking place and the fatality of these events. This tool allows us to analyze and compare the concentration of fatality in certain regions and conflicts.
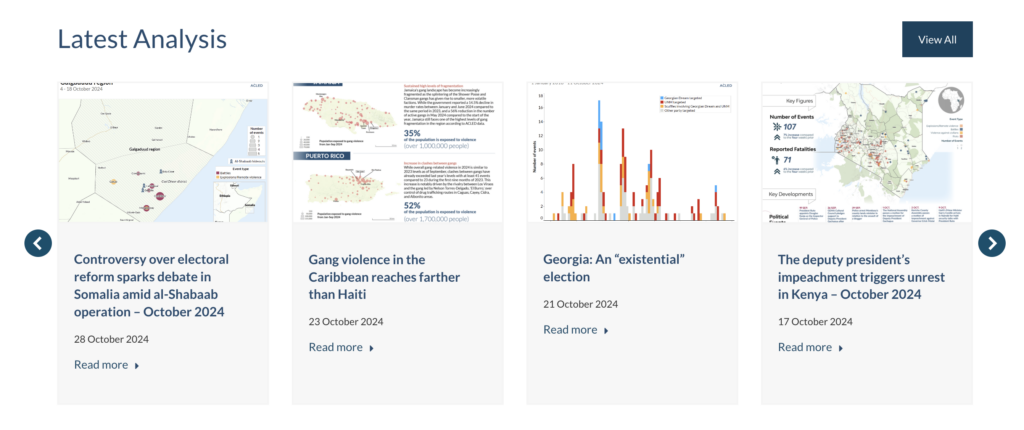
ACLED writers use a multitude of graphs and geographic charts to display the data collected as part of the project. Each article uses a different format to display data and allows for contextual analysis of the conflicts being described. Each article focuses on one example of violence and allows for a more in-depth analysis and description of the causes and effects of the conflicts occurring. While non-interactive the graphics provide clear and concise way of visualizing and processing data.