The following methodology section will be broken down into two categories: Map Methodology and Database Methodology. These sections comprise the primary methodologies behind the project.
Map Methodology
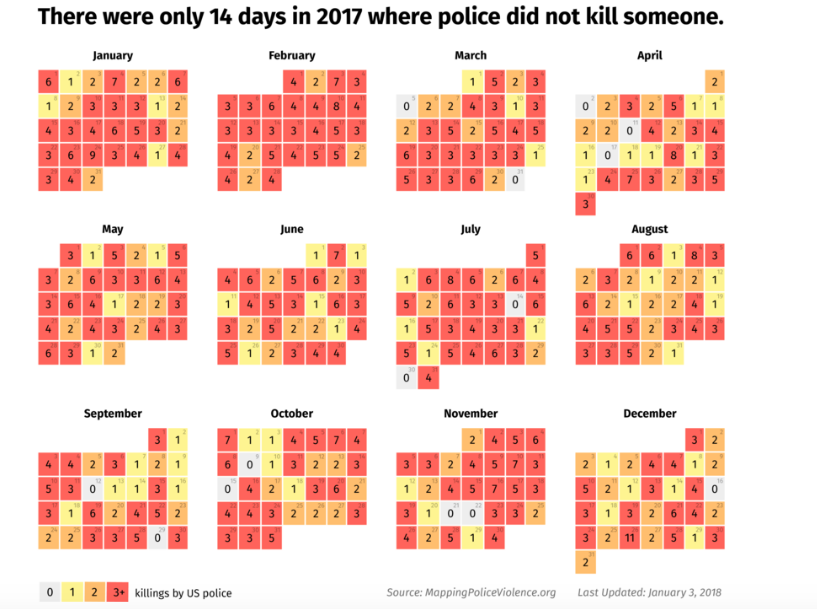
Mapping Police Violence uses interactive maps made by the mapping system CARTO. CARTO is a platform that builds powerful Location Intelligence Software with the best data streams available. The maps on the website include information on 1,131 known police killings – including 1,067 arrest-related deaths (according to Bureau of Justice Statistics definitions) as well as 64 unintentional, off-duty and/or in-custody deaths – that occurred in 2014. The site’s interactive maps, powered by CARTO, let the visitor explore a timeline and and actually see the events involving police killings occur as they pop up on the map in chronological order.
Database Methodology
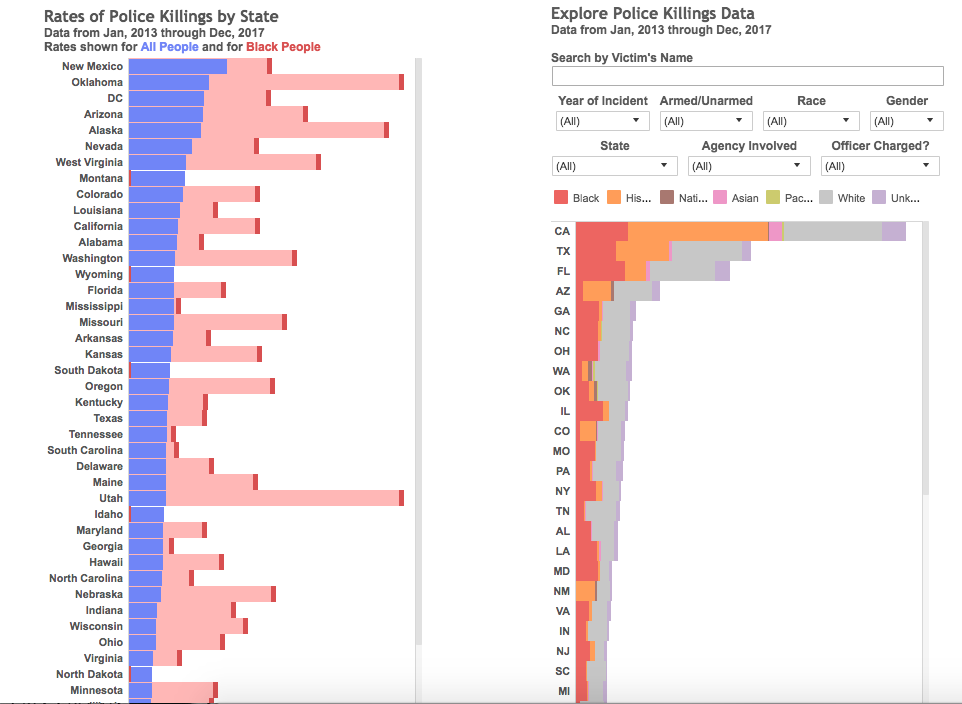
Mapping Police Violence uses database methodology by using a Police Accountability Tool. The tool is a interactive data visualization powered by Tableau Software. The database contains data form 2013 to 2017 involving every city in America, every police department in America, and every possible outcome on if the officer was charged or not. The information and data supplied was done so by using police killings data from January 2013 – December 2017, along with 2010 US Census population data by race and crime data from the 2014 FBI Uniform Crime Report. Police departments included in this analysis reflect the police forces of the 100 largest U.S. cities.