
Readability
This project is constructed with a format that makes it easy to understand. The use of bold headings and maps with simple keys allows for the reader to easily navigate through the information. Though the headings are colorful, the website as a whole is one dimensional and could use more than just pictures of maps to liven it up. There could have been pictures of Pride parades, drag shows, gay bars, or gayborhoods.
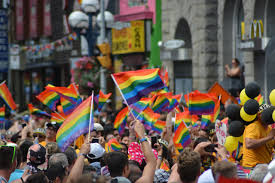
Pride parade 
Drag queens 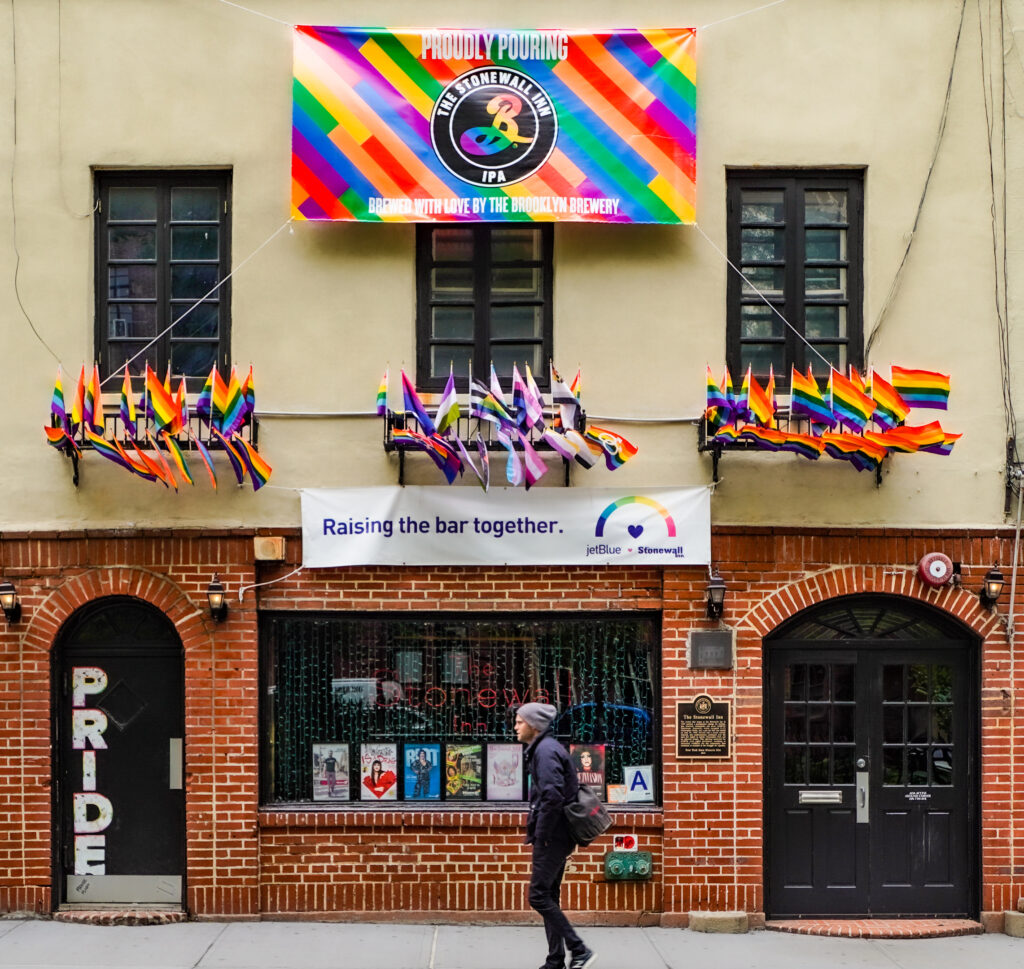
Stonewall, New York, NY 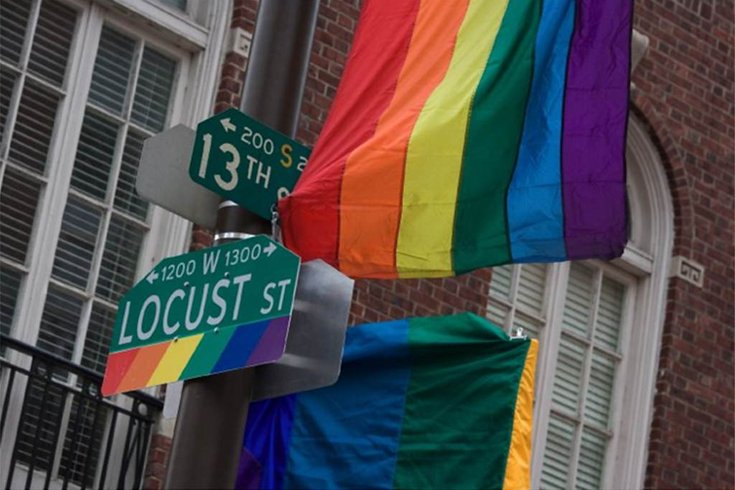
Gayborhood, Philadelphia, PA
Also, the project could have included something like an about me section rather than closing with a personal statement to their wife and their Twitter handle. The author and their wife live in Park Slope, one of the areas mentioned in the project. An about me page would not only visually improve the website, but it could also create a space to increase the author’s credibility and act as a better place to find more information about the author.
Information and Content
On the project’s website, the way that the page scrolls and shows the information at the beginning with the map of New York City, it gives the reader small bits of information in a way that is to the point and easy to digest. The following section explaining the index score seems a bit rushed and the graph used wasn’t explained or introduced well. Something nice about the project is that in nearly every paragraph there is a link that leads the reader to more in-depth information about various related topics. In the creation of this project, many different sources were used but also for nearly every city a quote from a resident is incorporated. This helps increase the appeal and trustworthiness of the information being presented. The map’s consistency throughout the project makes comparing the facts easy and convenient. One improvement to the project could be adding some type of visual showing all of the cities being mentioned in the project closer to the beginning. The way the project is set up now, it isn’t until halfway through the site that a list, that isn’t very prominent, is available to see.
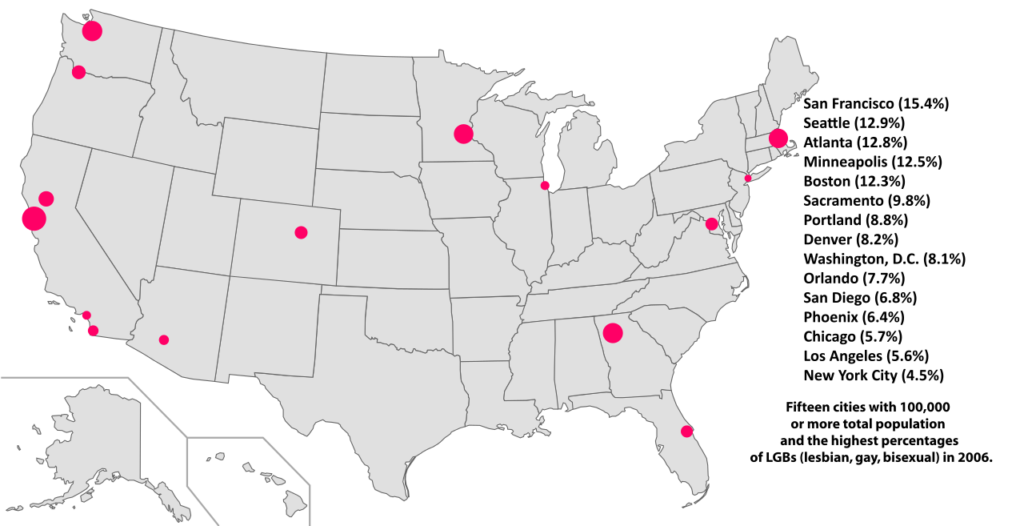
The data for the project was collected from crossing information from places with LGBTQ+ friendly laws, Yelp, same-sex couples that are documented as living together, and OkCupid. For creating these new maps showing different demographics and trends by compiling many different types of information they created impressive and useful results. Although some of the issues with the metrics used could have been explained in more detail. For example, if a bar does not label itself as a gay bar on Yelp then that bar is not included in the project, even though they are in fact a gay bar. Lastly, the project could have put more effort into its use and explantation of LGBTQ+ verbiage. The first time “LGBTQ” is used the term isn’t explained and neither is the term “gayborhood”. It isn’t until the ending paragraphs that the author addresses that they tried to use the term LGBTQ rather than gay but still readers could have used more information on what a gayborhood is. Overall, the digital humanities project Men are from Chelsea Women are from Park Slope meets its objective of visually showing how different major cities are divided by gender and the influence of LGBTQ+ people.
