Credibility & Transparency
Mapping Islamophobia: Visualizing Islamophobia And Its Effects does a very good job listing the contributors this project possess. While their are many contributors, the credibility is questionable. The majority of this projects creators are students, while only having one college level professor. Contributors include…
- Caleb Elfenbein, an associate professor of history and religious studies at Grinnell College, is primary investigator, serving as project editor and contributor.
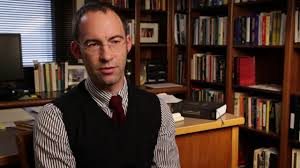
Caleb Elfenbein - Julia Schafer, whilea student at Grinnell College, served as a contributor, collecting and entering data and participating in discussions about project design and data coding. She also served as a research team leader and editor.
- Farah Omer, a student at Grinnell College, serves as a contributor, collecting and entering data and participating in discussions about project design and data coding.
(By visiting the About Our Project section of the project you can see the remaining members of the team responsible for creating the work)
While there are questions of Mapping Islamophobia: Visualizing Islamophobia And Its Effects credibility, there are none on the projects transparency. The projects contributors do a very good job of listing where they get their information from (visit About Our Project) and how they implement it into their maps. By referring to the “Maps” section of the project you can get a good grasp on the contributors level of transparency on how to understand their mapping…
“Each orange dot on this map represents an incident or event that reflects Islamophobic attitudes, ranging from instances of harassment and vandalism to national political speech and elections. Click on individual dots to reveal a short description of the event and a source for additional reading. It may be easier to do so if you use the zoom function, which will also enable you to see individual data points in areas with “hot spots,” indicated by deeper and brighter orange dots. You can “grab” the map to move around the country by left clicking your mouse and holding it down. You can view a single year or multiple years by using the click box in the upper left-hand corner of the screen. We also have a map of Islamophobic events and incidents as they accumulate over time, which shows when and where spikes of activity occur, an Interactive Map of Islamophobia (By Type), which allows you to filter events/incidents based on their classification, and an Interactive Map of Islamophobia (By Gender), which allows you to filter events/incidents based on the gender of the victim(s).”
Projects Looks & Design
The way Mapping Islamophobia: Visualizing Islamophobia And Its Effects is designed to give their visitors a very smooth and easy experience, while looking the part of modern and professional. The four sections all give their own layer of the project, and they are laid out in a way that it is easy to follow and find on the website. Aesthetically speaking the projects color scheme is grabs your attention while also not taking away from the data. The maps are a brilliant part of the website and are very easy to follow.
Final Evaluation
Overall Mapping Islamophobia: Visualizing Islamophobia And Its Effects is a very good DH Project and does a very good job of further completing its goal. The project itself is less than a year old, but goes back all the way to 2001 to collect their data. They have a good use of graphs throughout the project, including a heat map and a histogram. The projects methodology can be improved due to the project manually putting in the data, resulting in a selection bias. That being said, they are very clear on their methodology and how they set up their project. The projects contributors do say it is the Muslims responsibility to stop Islamophobia, which is wrong and brings up questions about their experience with the phobia. While this project does have some questions of its contributors credibility of experiencing islamophobia, it makes up for it with being very informative, transparent, engaging, unique, and having a visually pleasing design.
