
Team Go Birds mapped reported crimes in West Chester Borough to demonstrate the most and least safe areas based on police responses that lead to an arrest. Data was be collected from the Borough police department and mapped using arcgis.com. Projects like this have been done in the past, but because the subject of crime is dynamic year to year, an updated version of this project is due. The project includes data from the last 5 years in order to demonstrate which areas have proven to be the most dangerous over time.
The total amount of crime increased approximately 43% overall during calendar year 2021 from 1,157 such crimes
reported in 2020 to 1,662 such crimes reported during 2021. This is in-line with pre-pandemic numbers similar to 2019.
BAR GRAPH OF CRIME 2005-2021
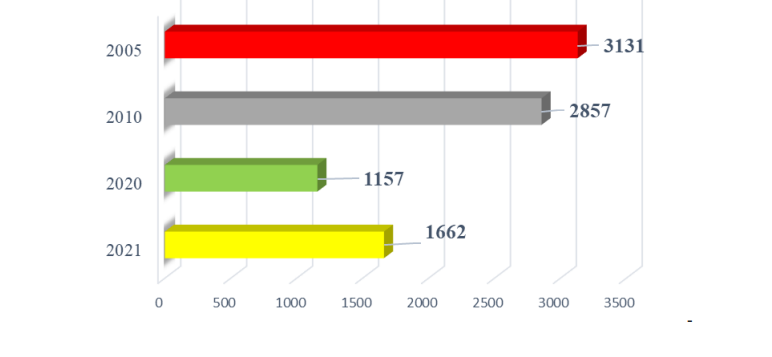
This graph shows the number of crimes committed by every 5-10 years in West Chester Borough going back to 2005. The West Chester Police Department uses this graph to show trends over time, whether it be up or down, in criminal activity. As demonstrated by the graph, crime was trending down in the borough from 2005-2020. Since 2020, crime has been increasing once again, likely due to rising economic difficulties following the beginning of the COVID-19 epidemic that has spread all over the world.
