https://dsl.richmond.edu/panorama/redlining

This is the third version of “Mapping Inequality: Redlining in New Deal America” released in 2023, it continues the collaborative effort of researchers, students, and technical experts. Directed by Robert K. Nelson, the project involves contributions from scholars and students who have helped develop spatial data.
This project features an interactive digital map created by a geospatial software service “mapbox” that visualizes historically redlined areas in major cities. Users can explore different cities, seeing how past housing policies have shaped present-day communities.
The first version of this project was released in 2016, bringing together historical maps and area descriptions from the Home Owners’ Loan Corporation (HOLC) to highlight the impact of redlining on American cities. It was developed through a collaborations between University of Richmond, Virginia Tech, Johns Hopkins University, and the University of Maryland.
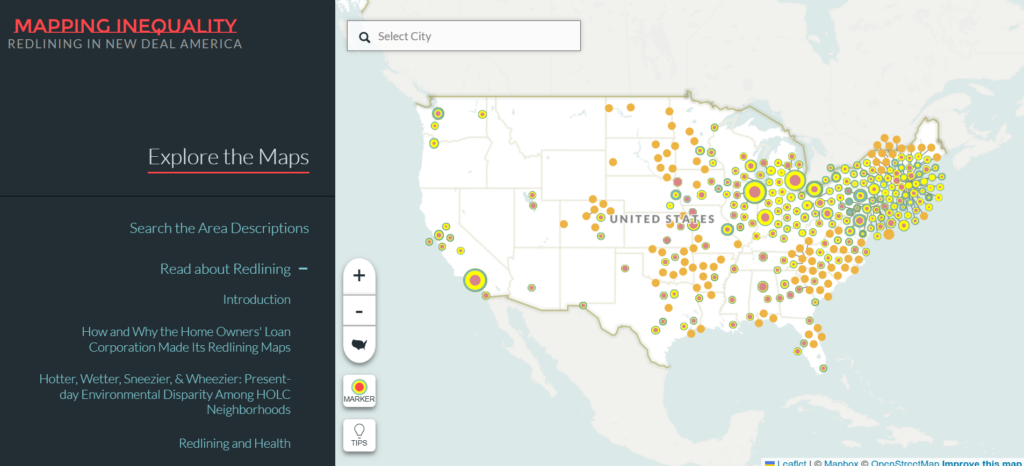
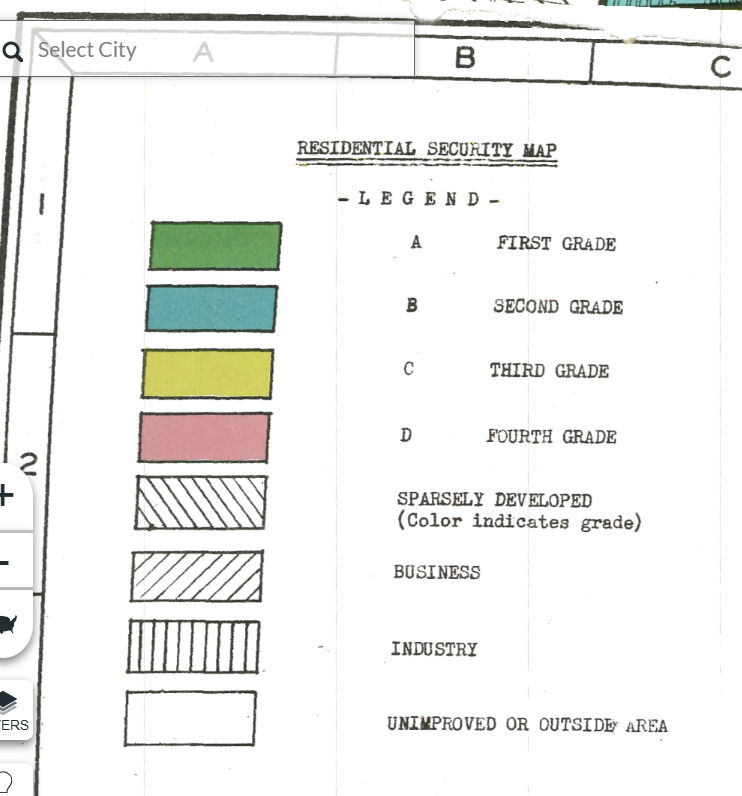
These maps categorized areas using a color-coded system:
- Green (“A” Grade – Best): Predominantly White “Wealthy” neighborhoods deemed the safest investments.
- Blue (“B” Grade – Still Desirable): Slightly less desired but considered stable communities.
- Yellow (“C” Grade – Definitely Declining): Older neighborhoods with growing immigrant or minority populations.
- Red (“D” Grade – “Hazardous”): Predominantly Black, Jewish, or immigrant neighborhoods deemed high-risk for investment.
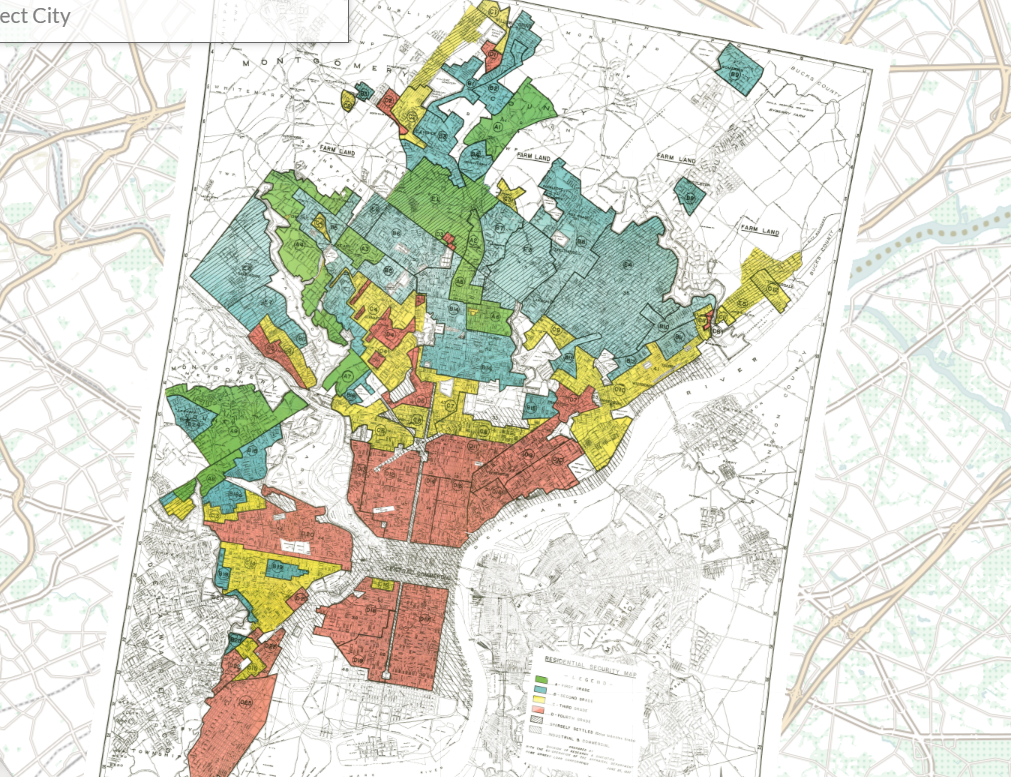

Insurers labeled these neighborhoods as “high risk,” charging excessively high premiums or refusing to provide fire insurance at all. Without fire insurance, homeowners and business owners couldn’t secure mortgages, trapping communities in cycles of disinvestment in communities.